
Short answer
The most common peptide impurities fall into three families: sequence errors (truncated sequences and deletion sequences), chemical modifications (oxidation, incomplete side-chain deprotection, and aggregation), and process residues (leftover reagents, scavengers, solvents, and counterions such as trifluoroacetate). Each arises at a specific step of solid-phase synthesis, and each shows up differently on HPLC and mass spectrometry.
This is interpretation guidance for analytical reports, not a synthesis protocol.
The Three Impurity Families to Know
Common peptide impurities fall into three families: sequence errors, chemical modifications, and process residues. Each family points to a synthesis step and to the test most likely to reveal it.
| Family | Examples | Where it starts | Typical analytical signature |
|---|---|---|---|
| Sequence errors | Truncated sequences, deletion sequences | Coupling or N-terminal deprotection during chain assembly1, 2 | Extra HPLC peaks; lower mass on MS |
| Chemical modifications | Oxidation, leftover protecting groups, dimers and oligomers | Final cleavage, purification, air exposure2, 3 | Specific mass additions on MS (for example +16 daltons (Da, the measure of molecular mass) for methionine oxidation)3 |
| Process residues | Trifluoroacetate (TFA) counterion, scavengers, residual solvents, water | Cleavage cocktail, HPLC mobile phase, drying4, 5 | Mostly invisible to HPLC purity; measured by separate tests6, 7 |
In short, HPLC quantifies and mass spectrometry (MS) identifies; details are below. How peptide impurities and non-peptide residues combine in the vial is covered in net peptide content vs purity.
A Quick Primer on How Peptides Are Synthesized
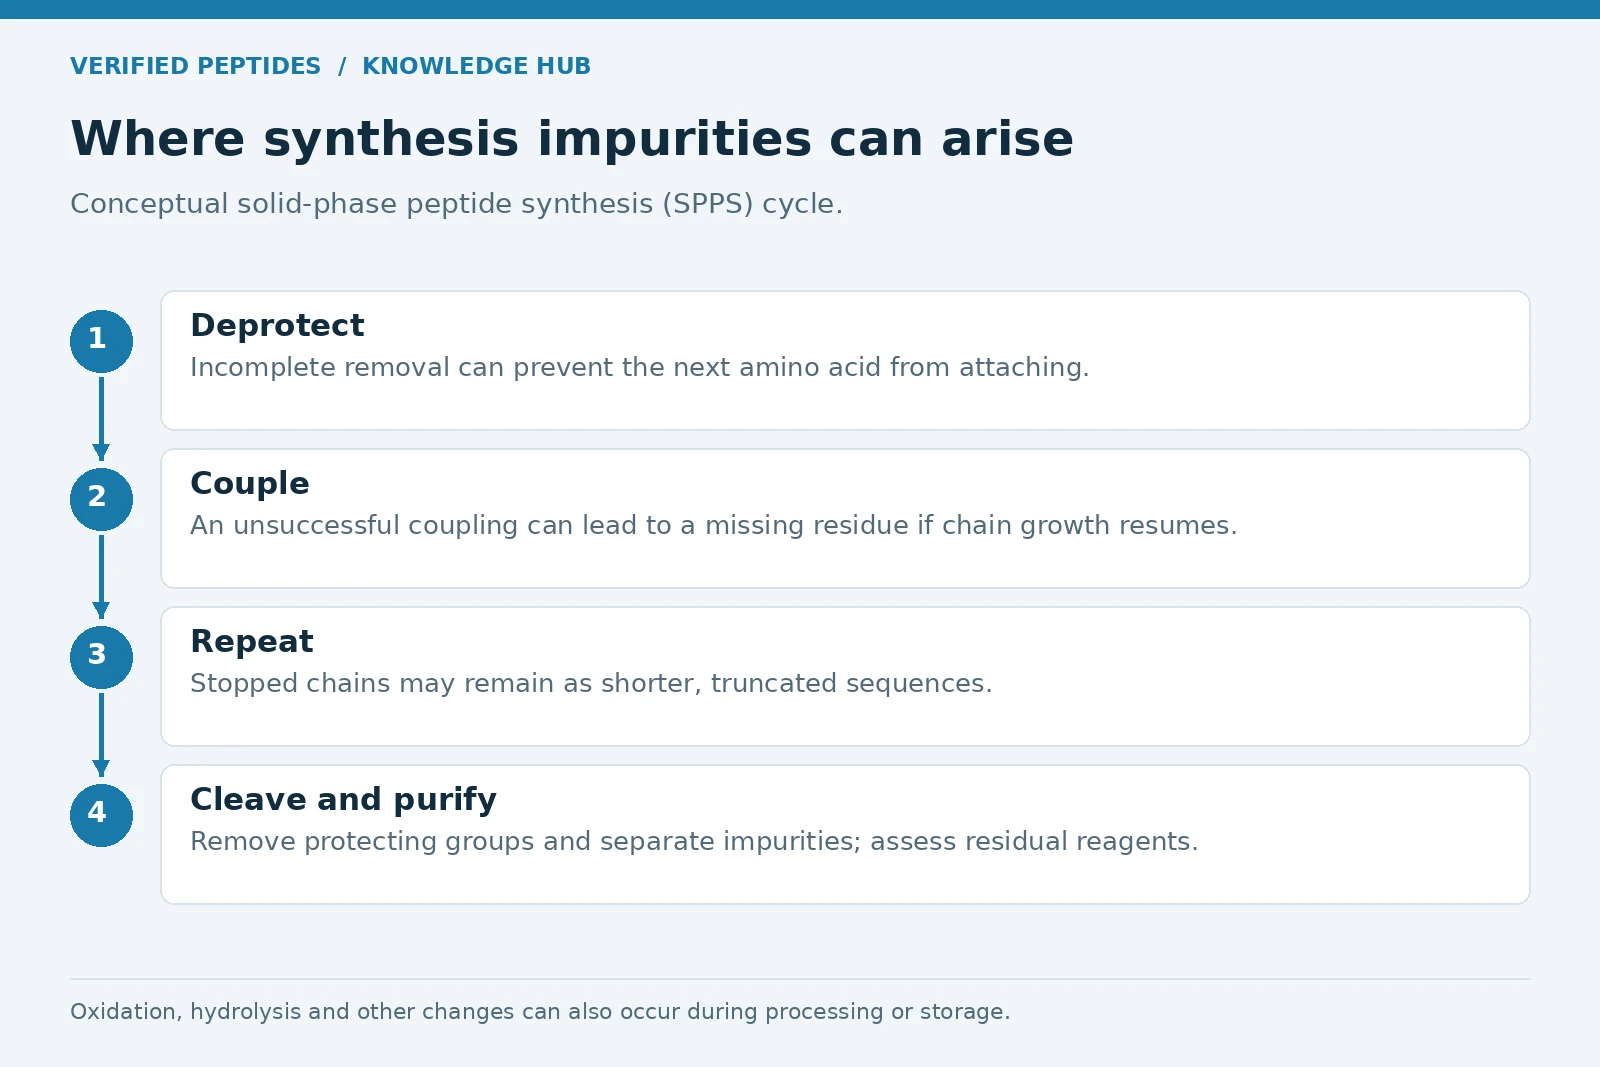
Research peptides are typically made by solid-phase peptide synthesis (SPPS): the chain is built one amino acid at a time on a resin bead, repeating a deprotection step and a coupling step for every residue, then the finished chain is cleaved off the resin.8
Because the process is cyclical, small inefficiencies accumulate. AltaBioscience notes that chains failing to react at a given cycle become truncated and deletion sequences, and that side-products are carried through to the end, since the peptide is usually purified only once, after cleavage.8 For scale, Gyros Protein Technologies notes that a 30-mer can carry more than 25% truncations even at 99% coupling efficiency.9 As illustrative arithmetic, 29 couplings at 99% each leave about 75% full-length chains.
This accumulation is a main reason purity varies between products: longer, more complex sequences generate more byproducts, which are harder to resolve by chromatography.8
Truncated Sequences
A truncated sequence is a peptide chain that stopped growing early, so it is missing one or more residues from one end. It usually forms when a coupling step fails and the chain does not continue.
Many synthesis labs deliberately cap chains that fail to couple, so they cannot react further; the failure then ends as a shorter, capped chain rather than a deletion.8, 9 On MS, a truncation appears lighter than the target; on HPLC it adds extra peaks. Every truncated chain left in the vial lowers the fraction of full-length target peptide.
Deletion Sequences (Deletion Mutants)
A deletion sequence, sometimes called a deletion mutant, is a chain missing one internal residue while the rest of the sequence was built normally, so it is close in size to the target but not identical.
It forms when one coupling step is incomplete, or when the N-terminal protecting group is not fully removed, and synthesis then continues past the gap.1, 2 Iris Biotech describes deletions as the most common impurities in synthetic peptides.7 On MS, a deletion shows a mass shift equal to the missing residue; for example, a missing glycine lowers the mass by about 57 Da and a missing leucine by about 113 Da.10, 11
Deletions matter because they are chemically similar to the target, so they are harder to separate during purification, and co-eluting impurities can be overlooked by chromatography alone.8, 9
Residual Reagents, Solvents, and Counterions
Residual reagents are chemicals left over from synthesis, cleavage, and purification: scavengers from the cleavage cocktail, residual solvents, and counterions such as trifluoroacetate or acetate.
Cleavage cocktails pair TFA with scavengers (reagents that trap reactive fragments) such as triisopropylsilane and water to quench reactive cations released from protecting groups.5 One review notes that reagents and solvents are unlikely to remain in the final peptide, except those used in final purification and isolation.2 For pharmaceutical substances, ICH Q3C groups residual solvents into three classes by toxicity and notes that they are typically measured by gas chromatography;12 useful context, though not written for research peptides.
Water and salts do not show up in an HPLC purity figure.7 Bachem lists separate methods: residual solvents by gas chromatography, water usually by Karl Fischer titration, and TFA by ion chromatography.6 Residues can still affect solubility and assay behavior, so a thorough report addresses them.
The TFA Counterion Question
Trifluoroacetate is the counterion peptides typically carry out of Fmoc synthesis (the standard SPPS chemistry): TFA cleaves the peptide from the resin and modifies the HPLC mobile phase, so cationic peptides come out as TFA salts unless a salt exchange is performed.4 Exchange to acetate or hydrochloride is possible, and acetate exchange uses milder conditions.4 The point is to know which salt form is in the vial, not to recommend one; see acetate and other counterions.
Chemical Modifications: Oxidation, Incomplete Deprotection, and Aggregation
Chemical modifications are full-length chains carrying an unwanted chemical change, identified largely by the specific mass difference each creates.
- Oxidation. Cysteine and methionine are sensitive to oxidation,1 and methionine can oxidize to the sulfoxide (an oxygen added at the sulfur) during synthesis and purification or on exposure to air. MS shows this as a +16 Da shift.3, 13
- Incomplete deprotection. Side-chain protecting groups that are not fully removed at cleavage leave peptide-protection adducts,2 which MS shows as the target mass plus the mass of the leftover group.
- Aggregation and dimers. Dimeric to oligomeric impurities have been reported in peptide products,2 and cysteine-containing peptides can form homodimers.1 These appear as higher-mass species; see methods for characterizing peptide aggregation.
How HPLC and Mass Spectrometry Reveal Impurities
HPLC quantifies how much impurity is present, and mass spectrometry helps identify what it is. Neither replaces the other.
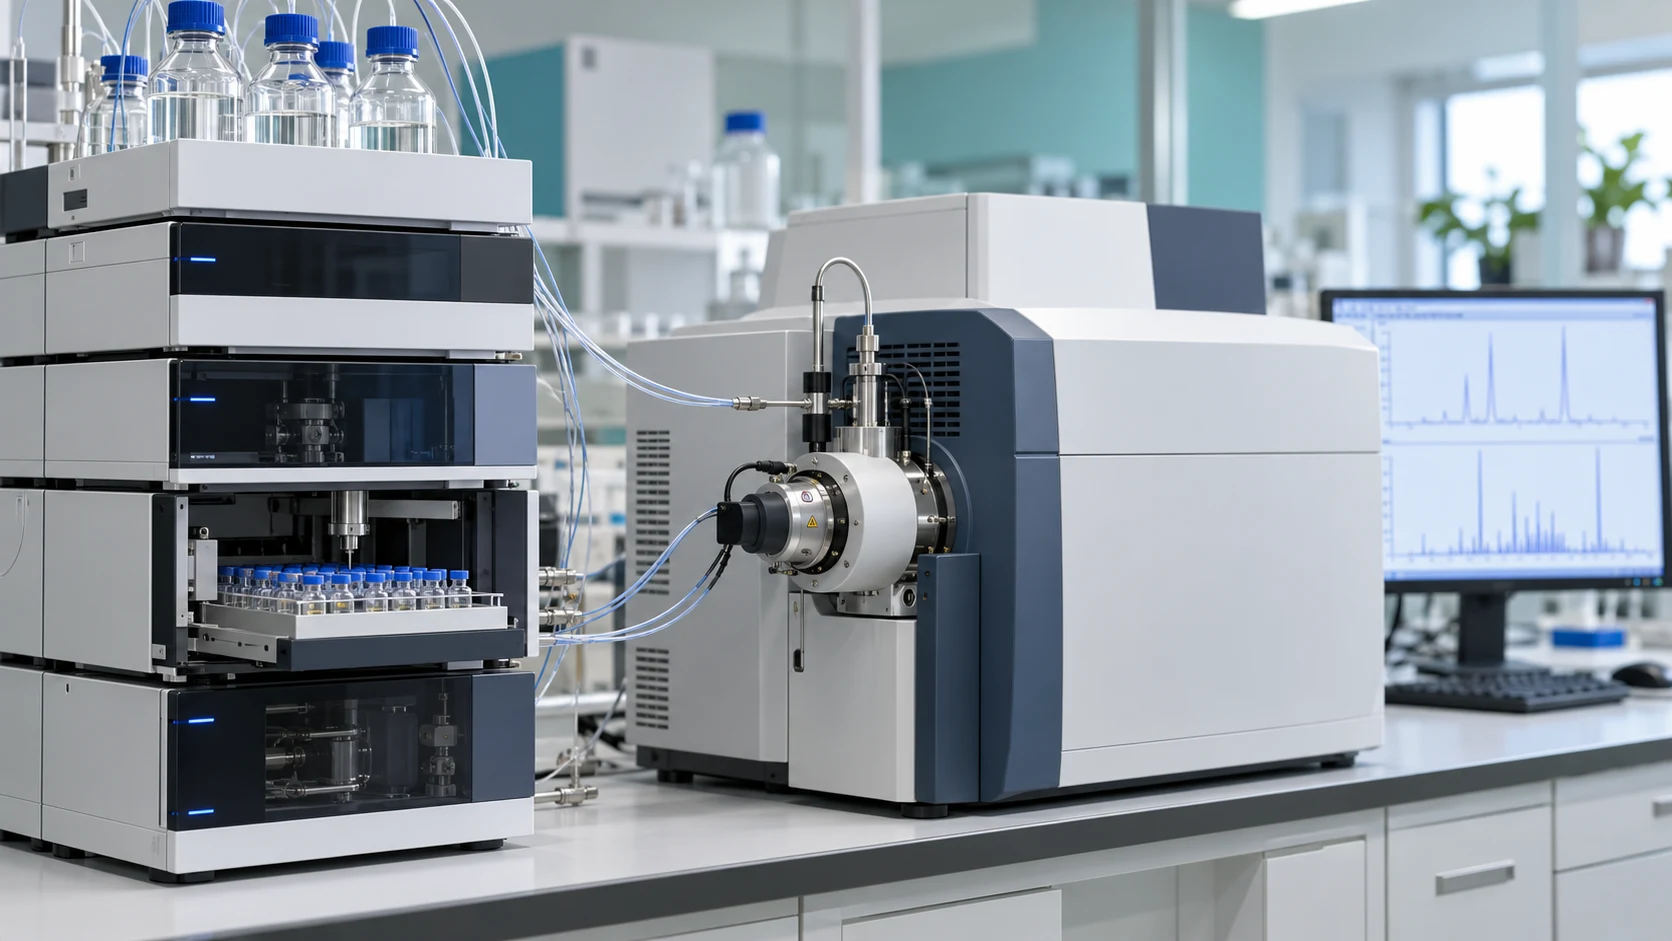
In reversed-phase HPLC, species separate by how strongly they interact with a nonpolar column under a polar mobile phase,14 and peptides are typically detected by UV at 210 to 220 nm. The target is the main peak, and purity is the area of the main peak relative to the total area of all peaks.6 Mass spectrometry determines molecular weight,6 and accurate-mass and fragmentation data can detect and assign low-level impurities that UV alone may miss.11
Purity by HPLC depends on the method: column, gradient, and detection wavelength all shape which impurities resolve from the main peak.6, 9 Pharmacopeial chromatography, such as USP <621>, sets system suitability checks for exactly this reason.15 Two purity figures are only comparable when the methods behind them are comparable.
Reading Impurities on a Certificate of Analysis
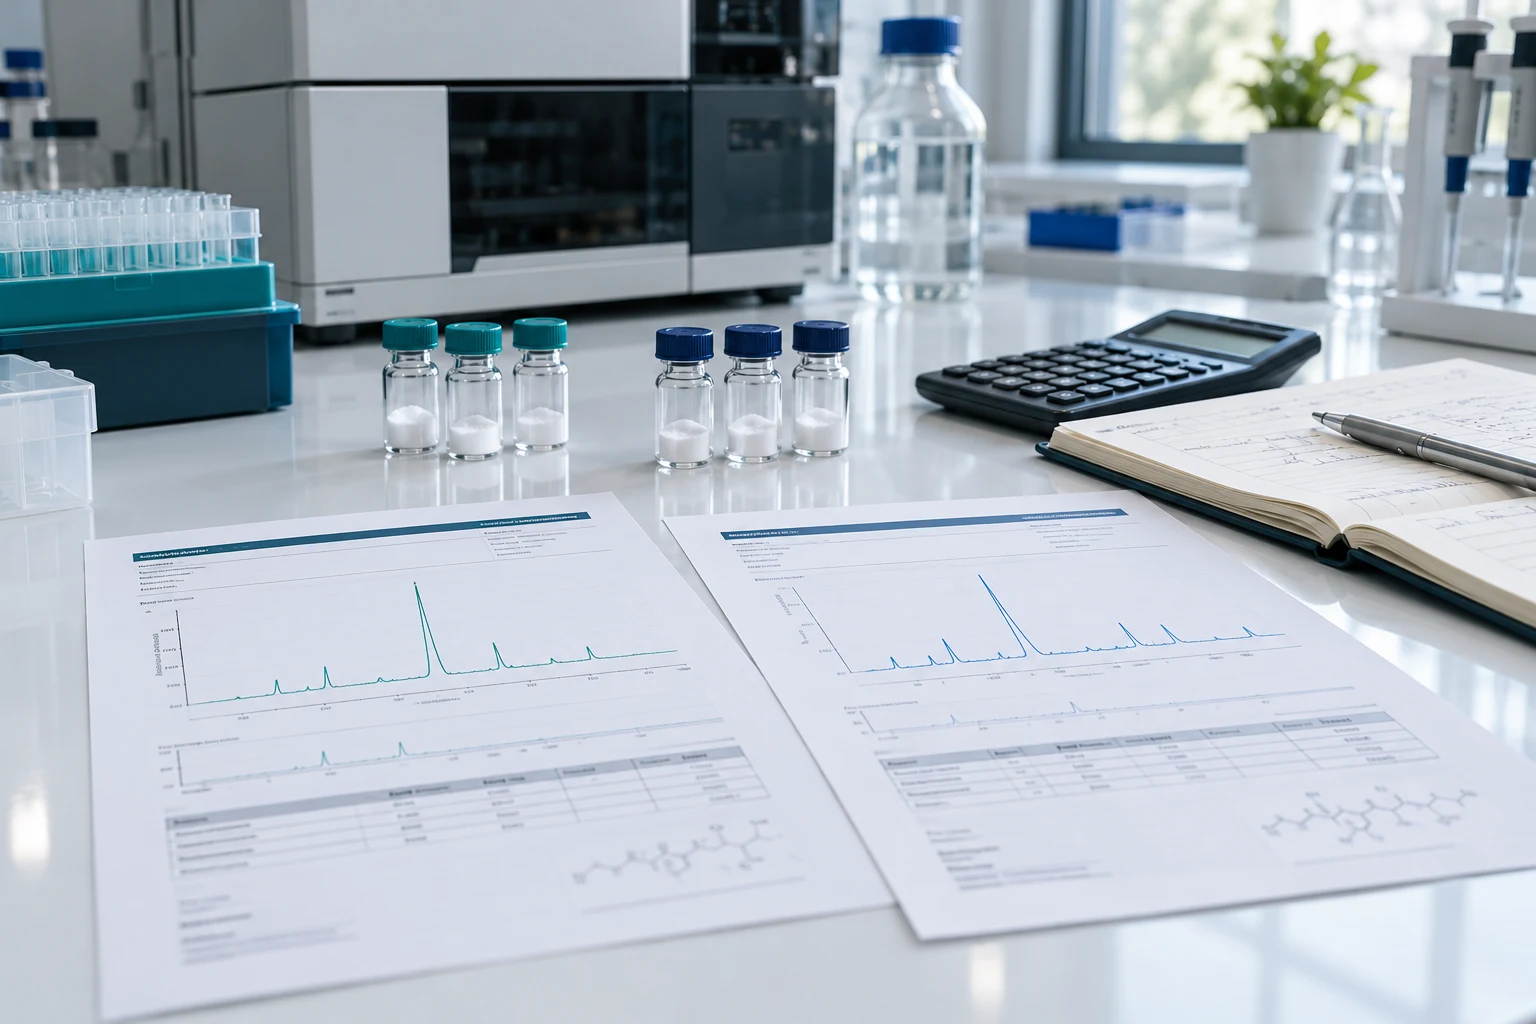
A thorough Certificate of Analysis (COA) shows an HPLC chromatogram with stated purity, a mass spectrum confirming identity, method details, and ideally counterion, residual solvent, and water results. A bare purity number is weak reporting.
- A chromatogram, not just a percentage, showing how many impurity peaks there are and how close they sit to the main peak.
- Method details: column, gradient, and detection wavelength.6
- A mass spectrum whose observed mass matches the theoretical mass of the sequence.
- Counterion identity and, where reported, TFA, water, and residual solvent results.6
- A batch number that ties every result to the material in hand.
Sanity-Checking the Reported Mass
Calculate the theoretical mass from the sequence and compare it with the observed mass on the report. Check whether it lists a monoisotopic or average mass: Matrix Science notes that for peptides and proteins the two differ by approximately 0.06%, and that larger molecules are usually reported as average mass.16 As an illustrative example, 0.06% of a 2,000 Da peptide is about 1.2 Da, so compare like with like. Observed masses lower by one residue, or higher by +16 Da, point back to the deletion and oxidation patterns above.
For field-by-field guidance, see what a good peptide COA should include and decoding lab reports; terms are defined in the peptide research glossary.
Frequently Asked Questions About Peptide Impurities
What are the most common impurities found in synthetic peptides?
They fall into three families: sequence errors (truncated and deletion sequences), chemical modifications (oxidation, incomplete deprotection, aggregation), and process residues (reagents, solvents, and counterions such as trifluoroacetate).
What is the difference between a truncated sequence and a deletion sequence?
A truncated sequence is missing residues from an end because the chain stopped growing early. A deletion sequence is missing an internal residue because one coupling failed but synthesis continued past it.1, 8
Where do residual reagents in peptides come from?
They are leftovers from coupling, cleavage, scavenging, and purification, including counterions such as trifluoroacetate from the cleavage cocktail and HPLC mobile phase.4, 5 Thorough reports address them with separate tests, apart from HPLC purity.6
How do HPLC and mass spectrometry work together to assess purity?
HPLC quantifies how much impurity is present as peak area percentages, while mass spectrometry confirms identity and helps assign what each impurity is by its mass difference.6, 11
Does a high HPLC purity number guarantee a clean peptide?
No. Purity depends on the method, co-eluting impurities can be missed, and the figure says nothing about counterion, water, or solvent content.7, 9
Why do impurity profiles differ between peptide products?
Longer and more complex sequences accumulate more sequence-related byproducts, which are harder to separate.8 Purification and reporting rigor also vary by supplier.
What is the TFA counterion in peptides?
Trifluoroacetate is the counterion left from TFA used in cleavage and reversed-phase purification, so many peptides are supplied as TFA salts unless a salt exchange is performed.4
All peptides discussed here are for research use only.
Key Takeaways
- Common peptide impurities fall into three families: sequence errors, chemical modifications, and process residues.
- HPLC tells you how much impurity is present; MS helps tell you what it is, often from a specific mass difference.
- A high purity percentage means more with a chromatogram, a confirming mass spectrum, and counterion, water, and solvent reporting.
- Review the full analytical documentation, not just the headline purity figure.
References
- Bosc-Bierne G, Weller MG. Investigation of impurities in peptide pools. Separations. 2025;12(2):36. mdpi.com
- D’Hondt M, Bracke N, Taevernier L, et al. Related impurities in peptide medicines. Journal of Pharmaceutical and Biomedical Analysis. 2014;101:2-30. PubMed 25044089
- Iris Biotech GmbH. Modifications of Methionine. December 2020. iris-biotech.de
- Sikora K, Jaśkiewicz M, Neubauer D, Migoń D, Kamysz W. The role of counter-ions in peptides: an overview. Pharmaceuticals. 2020;13(12):442. PMC7761850
- Merck KGaA (Novabiochem). Fmoc Resin Cleavage Protocols. Technical guide. sigmaaldrich.com
- Bachem. Quality Control of Amino Acids & Peptides: A Guide. Knowledge center. bachem.com
- Iris Biotech GmbH. Net Content and Purity, Two Key Parameters in Peptide Synthesis. 2025. iris-biotech.de
- Alta Bioscience. Peptide Screening: What Makes a High-Quality Screening Peptide? altabioscience.com
- Gyros Protein Technologies. Catch-and-Release Peptide Purification. American Peptide Society industry partner page. americanpeptidesociety.org
- Matrix Science. Amino acid reference data (Mascot help documentation). matrixscience.com
- Waters Corporation. Synthetic Peptide Characterization and Impurity Profiling Using a Compliance-Ready LC-HRMS Workflow. Application note 720006367, 2018. waters.com
- International Council for Harmonisation. Q3C Impurities: Residual Solvents (Guidance for Industry, US FDA, December 1997; companion Q3C Tables and List, Revision 3, June 2017). fda.gov
- Denton E. How to Handle Peptides That Contain Methionine. Biotage, February 2023. biotage.com
- Alta Bioscience. HPLC Analysis and Applications. altabioscience.com
- United States Pharmacopeia. Notice of Adoption of Harmonized Standard: <621> Chromatography (posted November 19, 2021; official December 1, 2022). usp.org
- Matrix Science. Mass accuracy and resolution (Mascot help documentation). mascot.biotech.illinois.edu