
Short answer
Batch-to-batch variability in synthetic peptides is normal within reasonable analytical tolerances, but it should be small, documented, and within the supplier’s stated specifications. To monitor it, compare four fields on each batch’s Certificate of Analysis (COA): purity, net peptide content, identity confirmation, and impurity profile.
This guide covers what causes peptide batch-to-batch variability, what counts as acceptable variation, what to compare across COAs, and how to judge whether a supplier stays consistent over time.
Quick Answer: How Much Variability Is Normal?
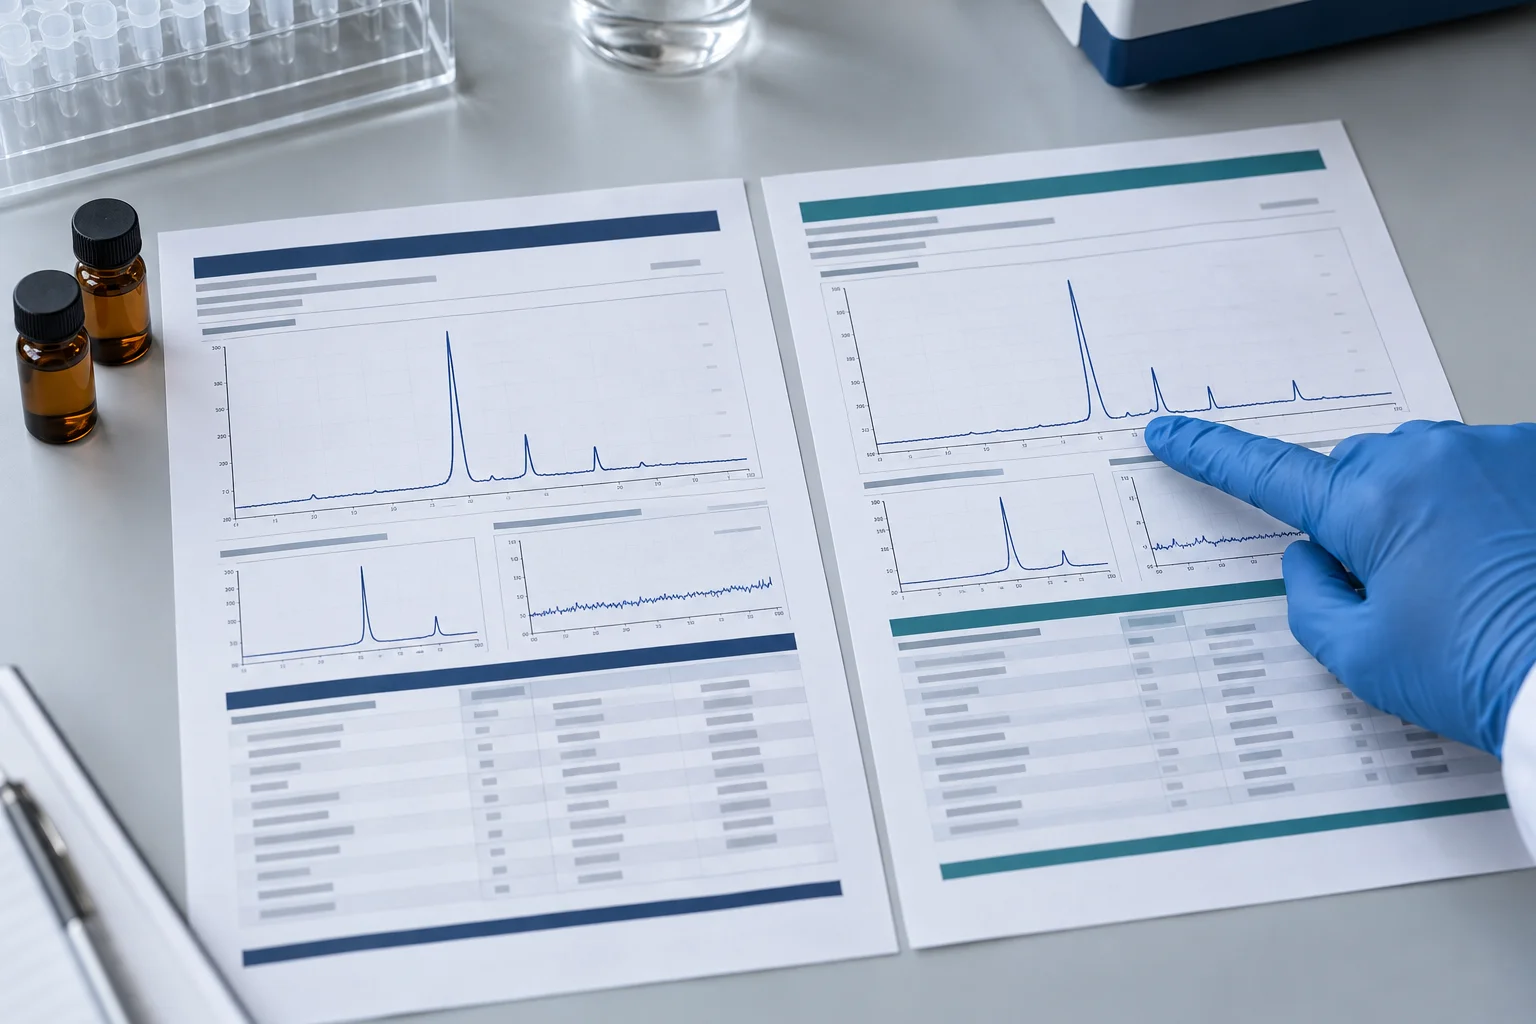
Expect close agreement, not identical numbers. A well-controlled process tested with the same method typically gives closely matching high-performance liquid chromatography (HPLC) purity and net peptide content, but the impurity profile and especially the peptide content can vary somewhat from batch to batch, even when synthesis and purification protocols have not changed.1, 2
Larger swings, such as 99% purity in one batch and 92% in the next, or new or much larger impurity peaks, deserve investigation rather than being dismissed as normal scatter; first check for changes in the method, sample preparation or reporting. Variability also tends to be more noticeable at lower purity grades, where lots can contain peptide-related byproducts that differ in both proportion and structure.3
To judge a specific lot, read the acceptance range printed on its COA (for example, a minimum HPLC purity) rather than relying on a generic rule of thumb. A tight specification that stays the same from lot to lot is more reassuring than a wide one, or one that changes between reports. If a COA shows a result but no specification, ask the supplier what limit the lot was released against.
For example, if the agreed minimum is 98%, a result of 97.9% does not meet it. A change from 99.2% to 98.7% is 0.5 percentage points: it may still meet that minimum, but the trend and any new impurity peaks deserve attention. These examples are not a universal permitted variation.
Why Batches Vary in the First Place
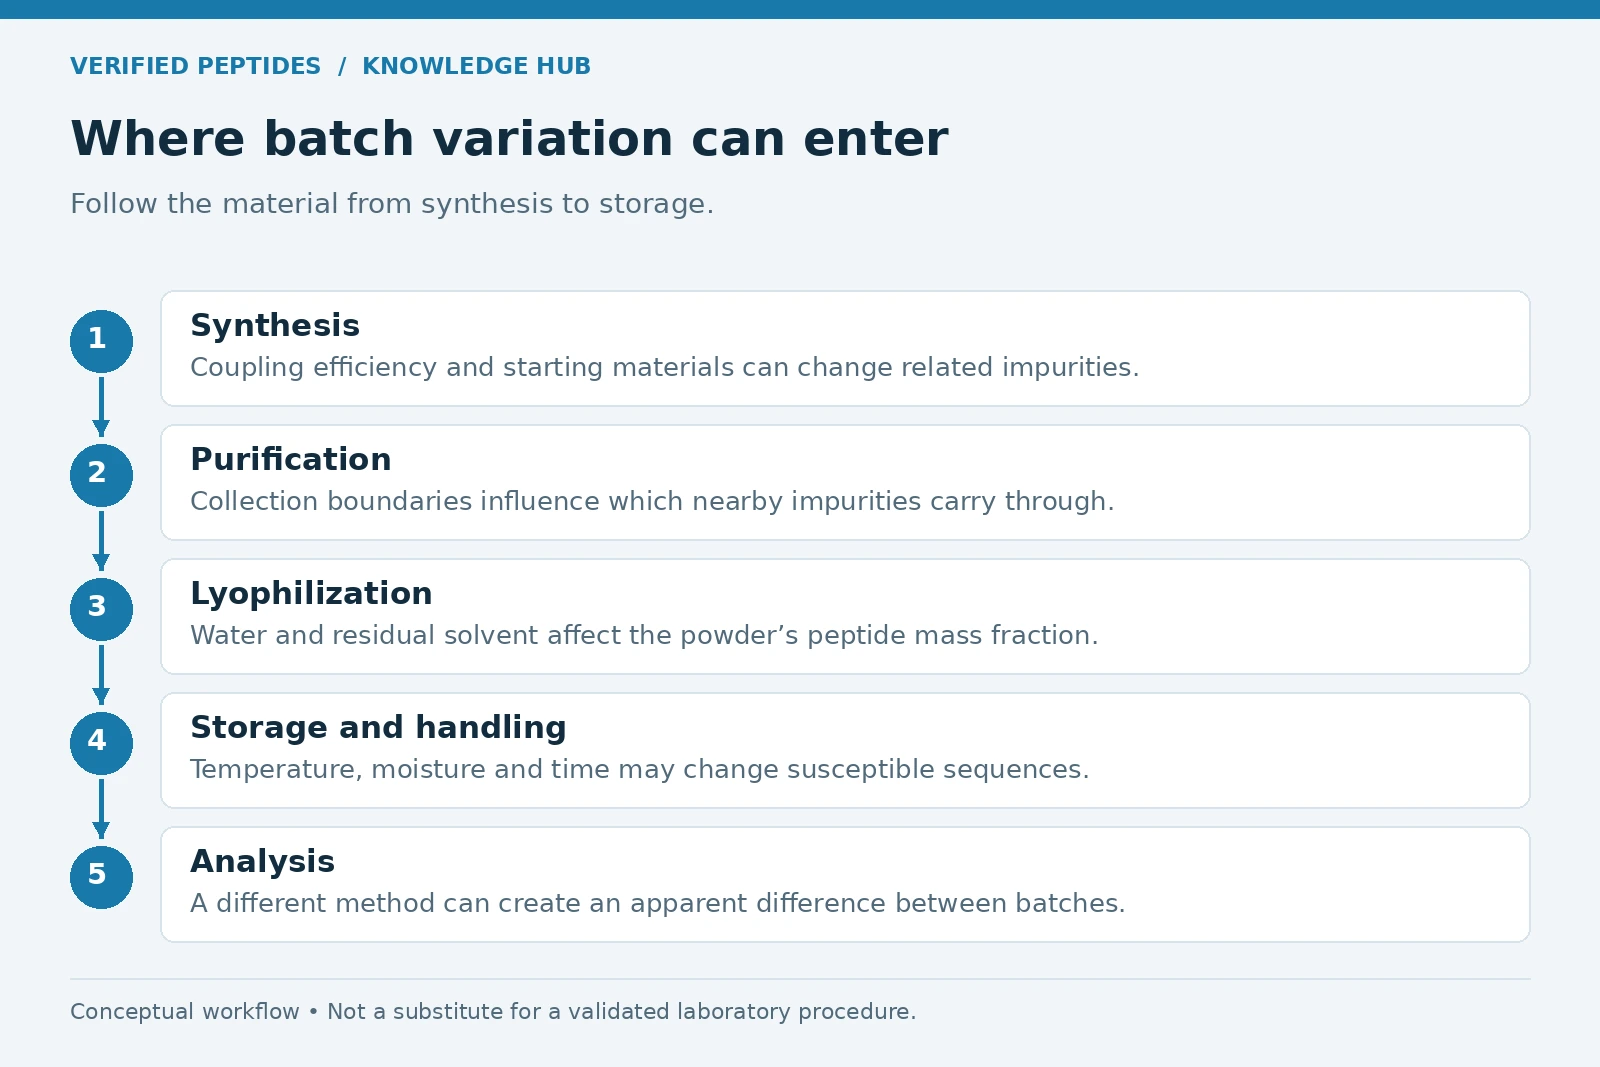
Every manufacturing step adds a little batch-to-batch variability. None is disqualifying alone, but together they are why reproducible quality control (QC) matters. Good QC does not eliminate this variation; it characterizes it and keeps it within specification.
| Source | What changes | What it affects |
|---|---|---|
| Synthesis chemistry | In solid-phase peptide synthesis (SPPS), each coupling and deprotection step is slightly imperfect, leaving byproducts such as deletion sequences.4 | Purity and impurity profile |
| Starting materials | New lots of amino acid derivatives, resins, or coupling reagents, each carrying its own minor impurities | Impurity profile |
| Purification | Where main-peak collection starts and stops differs slightly between runs, so closely eluting impurities carry over in slightly different amounts | Minor impurity carryover |
| Lyophilization | Residual water and solvent vary from run to run; counter-ions such as trifluoroacetate (TFA) add non-peptide mass5 | Net peptide content |
| Storage and handling | Heat, moisture, or time before testing can degrade sensitive sequences | Purity and new degradation peaks |
Some apparent differences come from the analysis rather than the material, for example a new HPLC column or a different testing laboratory. That is why method conditions are the first thing to check when comparing COAs.
What to Compare Across Batches of the Same Peptide
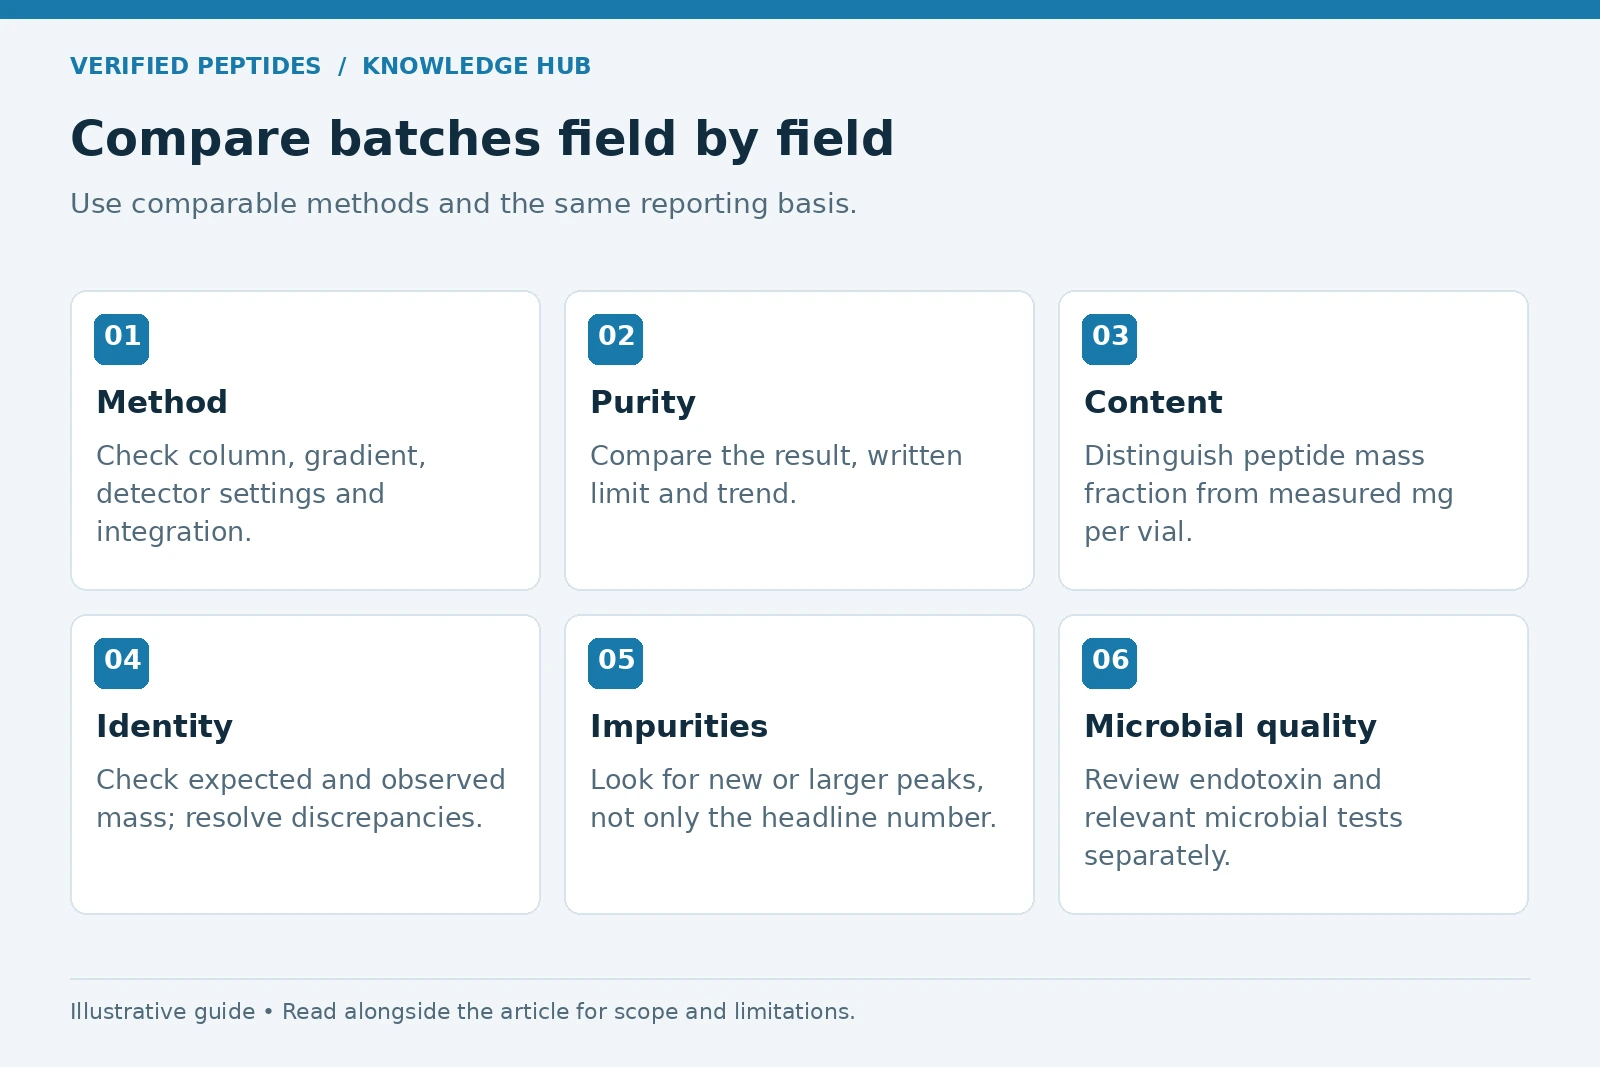
Compare COAs field by field, not just headline purity, and start with the method. If the column, gradient, detection wavelength, or flow rate differ, the two chromatograms are not directly comparable.6
A matching intact mass supports identity, but it does not prove the complete sequence or distinguish every isomer. Resolve identity questions with appropriate additional characterization.
| COA field | What it tells you | Consistent batches show |
|---|---|---|
| Method conditions | Column, gradient, wavelength, and flow rate | Comparable, documented conditions; check this first |
| HPLC purity (area-percent) | The main peak’s share of total chromatogram signal | Within specification and a tight range |
| Net peptide content | Peptide share of the powder, excluding water, salts, and counter-ions | Small differences within method precision; large swings change how much peptide a weighed sample contains |
| Mass spectrometry | Identity evidence: observed mass versus the mass calculated from the sequence | A match within the method’s tolerance; hold an unexplained mismatch for investigation |
| Impurity profile | The pattern of minor peaks beyond the main peak | The same peaks in similar proportions |
| Endotoxin and sterility | Endotoxin, commonly by LAL assay, and microbial contamination7 | Endotoxin: a pass on every batch, with no upward trend across lots. Sterility: a pass on every batch where sterility is specified; otherwise check microbial limits results |
Endotoxin deserves a trend view, not just a pass or fail. A steady rise across several lots, even while each result passes, can signal a developing contamination source in the process, such as water or buffers, where bacteria can grow. Because endotoxin is heat-stable and is not destroyed under routine sterilizing conditions, a sterility pass does not rule it out.8
Why Net Peptide Content Matters at the Bench
Net peptide content is the actual percentage of peptide in the gross powder weight. The rest is non-peptide material such as water, residual solvent, salts, and counter-ions.2
If the COA reports measured peptide content directly in mg per vial, use that value. Do not multiply it by a peptide-content percentage again. A percentage describes a mass fraction; mg per vial describes an amount.
Most HPLC-purified synthetic peptides are isolated as TFA salts, with counter-ions paired to the N-terminus and basic residues.2, 5 As a result, net content is commonly lower for peptides rich in basic amino acids and for hydrophilic peptides.3
This matters whenever concentration accuracy matters. If one lot’s net content is noticeably lower than the last, the same weighed mass contains less peptide, and a stock solution prepared from gross weight comes out more dilute than intended. Using each lot’s stated net content when calculating concentrations keeps experiments comparable across batches.2
Why the Impurity Profile Is One of the Most Useful Comparisons
Because identical purity numbers can hide different impurities: two batches can both report 99% purity yet show different minor peaks at different retention times (when each compound exits the column).
A new peak, such as a deletion sequence from an incomplete coupling or an oxidation product, suggests a changed starting-material lot, process step, or synthesis route.4 GMP guidance likewise compares impurity profiles against historical data to detect process changes.9
A peak that was absent from earlier lots is worth raising with the supplier even when overall purity still meets specification. The purity number tells you how much main peak there is; the profile tells you whether the process that made it has changed.
What Is and Isn’t Acceptable Variability
Acceptable variability stays within specification and leaves the overall pattern unchanged. Sort differences into three tiers.
| Tier | Examples |
|---|---|
| Generally acceptable | Small shifts within a stable specification and the method’s expected variability, with comparable impurity profiles; the numbers alone do not establish acceptability. |
| Worth investigating | A one-time drop just inside specification, a slightly changed impurity pattern, or small retention-time shifts (often a new column) |
| Not acceptable | A confirmed result below specification, a confirmed identity failure, or failure of a required endotoxin or microbial test. Hold unresolved major impurity or method changes for investigation. |
Use the tiers as triage. A borderline result is not a failure, but it is a reason to compare the next lot closely and to note the change in your lab records.
Any failure in the bottom tier warrants contacting the supplier with the specific field and values.
How to Evaluate a Supplier’s Batch Consistency Over Time
Judge a supplier by its published COA history, not a single report. One strong COA shows that one lot passed; a series of lots shows whether the process stays under control.
- Compare the two or three latest COAs for the same peptide side by side.
- Confirm each COA is batch-specific, not one report reused across lots.
- Check that the same third-party lab tested each batch; a lab change can introduce method-driven variation.
- Check that method conditions are listed on each COA, so reports can actually be compared.
- Look for stable specifications across reports, not limits that widen over time.
- Prefer a long archive of batches over one or two reports.
An inability to obtain a batch-specific COA is a red flag, however strong any single report looks. For reference, Verified Peptides publishes a Lab Reports archive of batch-specific third-party reports.10 See also why batch-specific COAs beat generic PDFs and how to read a peptide COA.
What to Do When a New Batch Looks Different
Work through four steps so your question to the supplier is specific.
- 1Match the method Confirm the column, gradient, detection wavelength, and flow rate match between the two COAs. Many apparent differences come from test conditions, not the material.
- 2Pinpoint the field Identify exactly which field differs: purity, net content, a specific impurity peak, sterility, or endotoxin. Note the values from both lots.
- 3Ask the supplier Send the field and values, and ask the three questions below.
- 4Hold if needed Consider holding the lot until you have an answer, especially for sensitive cell culture or in vitro work.
- Did the synthesis route or any starting-material lot change for this batch?
- Was the same analytical laboratory used as for the previous batch?
- Was the HPLC column, method, or detection setting updated?
Reputable suppliers answer promptly and specifically. A vague answer, or none, is itself useful information when deciding whether to accept the lot.
Why Third-Party Testing Makes Consistency Easier to Verify
When one independent laboratory tests every batch with the same validated method, COAs are directly comparable, so differences are more likely to reflect the material, within the method’s stated precision.11
USP General Chapter <621> system suitability checks confirm an HPLC system is performing as expected before results are reported.6 When testing rotates between labs or methods, apparent variability may reflect the analysis instead; see independent peptide batch testing.
Using the same laboratory can make comparisons easier, but it does not guarantee identical methods. Check the method identifier and conditions on each report, and ask about any change before comparing the numbers.
Frequently Asked Questions About Peptide Batch Variability
Why do peptide batches vary at all?
Because synthesis, purification, and lyophilization each add small, unavoidable variation. Good QC does not eliminate it; it characterizes the variation and keeps it within specification.
How much purity variation is acceptable between batches?
Generally only a small amount, and always within the supplier’s stated specification. Check the acceptance range printed on each COA rather than relying on a generic tolerance; larger swings between lots warrant investigation.
What is an impurity profile?
It is the pattern of minor HPLC peaks beyond the main peak. Comparing profiles across batches reveals process changes that a single purity number can miss.
What should I check first when comparing two batches?
Method conditions. Once they match, compare identity confirmation, purity, net peptide content, and impurity profile, in that order.
Should I be concerned if a new batch has different impurity peaks?
Generally, yes. Ask the supplier about any new or noticeably larger peak, even if purity is within specification.
Why does net peptide content matter if purity is high?
Because the two measure different things. Purity is the main peak’s share of the chromatogram, while net content is the peptide share of the total powder weight, including water, salts, and counter-ions. A high-purity lot can still have lower net content, which changes concentrations prepared by weight.2
How can I verify a supplier’s batch consistency before accepting a new lot?
Review the supplier’s published archive of batch-specific COAs, ideally from the same third-party lab and method, and compare the latest lots side by side.
Are all peptide batches the same quality?
Not exactly. Well-controlled batches are closely matched but never identical, which is why each batch needs its own COA and comparison against earlier batches.
All peptides discussed here are for research use only.
Key Takeaways
- Some peptide batch-to-batch variability is normal, but it should be small, documented, and within the specification stated on the COA.
- Comparing purity, net content, identity, and impurity profile is the practical way to catch drift early.
- Confirm method conditions match before comparing anything else.
- Use each lot’s stated net peptide content when preparing solutions, and quarantine any lot with an identity mismatch.
- Published batch-specific COAs from a consistent third-party lab make consistency verifiable from the researcher’s side.
Before accepting a new lot, review your supplier’s batch archive; specific comparison questions are a normal part of laboratory quality checks.
References
- Bachem. Do I have to expect batch-to-batch variability? (FAQ). bachem.com
- AAPPTec. Peptide Quality: Frequently Asked Questions. peptide.com
- Bachem. Quality Control of Amino Acids and Peptides: A Guide. January 2025. bachem.com
- D’Hondt M, Bracke N, Taevernier L, et al. Related impurities in peptide medicines. Journal of Pharmaceutical and Biomedical Analysis. 2014;101:2-30. PubMed 25044089
- Sikora K, Jaśkiewicz M, Neubauer D, Migoń D, Kamysz W. The role of counter-ions in peptides: an overview. Pharmaceuticals. 2020;13(12):442. PMC7761850
- United States Pharmacopeia. General Chapter <621> Chromatography (system suitability). USP-NF. uspnf.com
- US Food and Drug Administration. Pyrogen and Endotoxins Testing: Questions and Answers. Guidance for industry (revised), March 2026. fda.gov
- Magalhães PO, Lopes AM, Mazzola PG, Rangel-Yagui C, Penna TCV, Pessoa A Jr. Methods of endotoxin removal from biological preparations: a review. Journal of Pharmacy and Pharmaceutical Sciences. 2007;10(3):388-404. J Pharm Pharm Sci
- US Food and Drug Administration / ICH. Q7 Good Manufacturing Practice Guidance for Active Pharmaceutical Ingredients (sections 11.2 impurity profiles and 11.4 certificates of analysis). fda.gov
- Verified Peptides. Lab Reports (batch-specific third-party test reports). verifiedpeptides.com
- International Council for Harmonisation. ICH Q2(R2) Validation of analytical procedures (scientific guideline, European Medicines Agency). ema.europa.eu