
Tesofensine (400 mcg, 60 units)
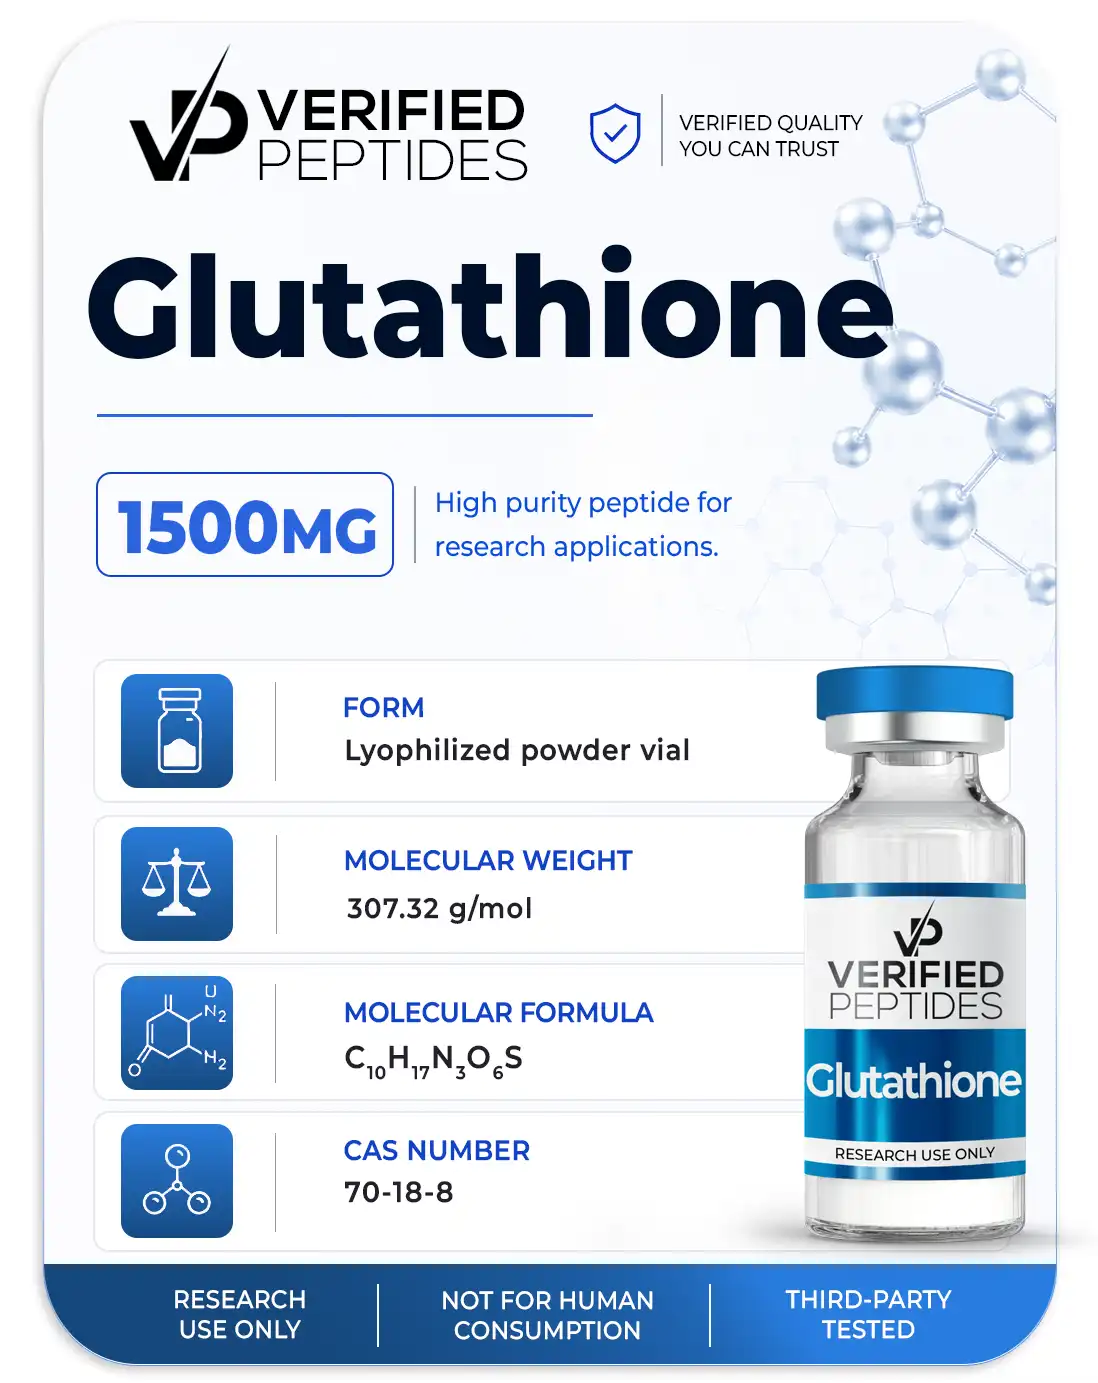
Glutathione Peptide (1500MG)
This batch of Glutathione has been third party lab tested and verified for quality.

TESTED FOR:

purity
weight
endotoxins(lps)
$79.99
| Quantity | Price | |
|---|---|---|
| 0% | 1 - 4 | $79.99 |
| 10% | 5 - 9 | $71.99 |
| 20% | 10 - 19 | $63.99 |
| 30% | 20 + | $55.99 |
This product comes as lyophilized powder and is not reconstituted. All products and materials sold on this site are for Research Use Only and not for human use; subject to our Terms and Conditions.

ICE PACK SHIPPING
Styrofoam box shipping available
| Peptide vial specifications | Results | |
|---|---|---|
Not reconstituted | ||
Bottle type: | vial - sealed - flip top | |
Form: | Powder (lyophilized) | |
Vial size: | 20ML - large | |
Glutathione Certificate of Analysis (COA) Test Result
| Date Tested: | |
|---|---|
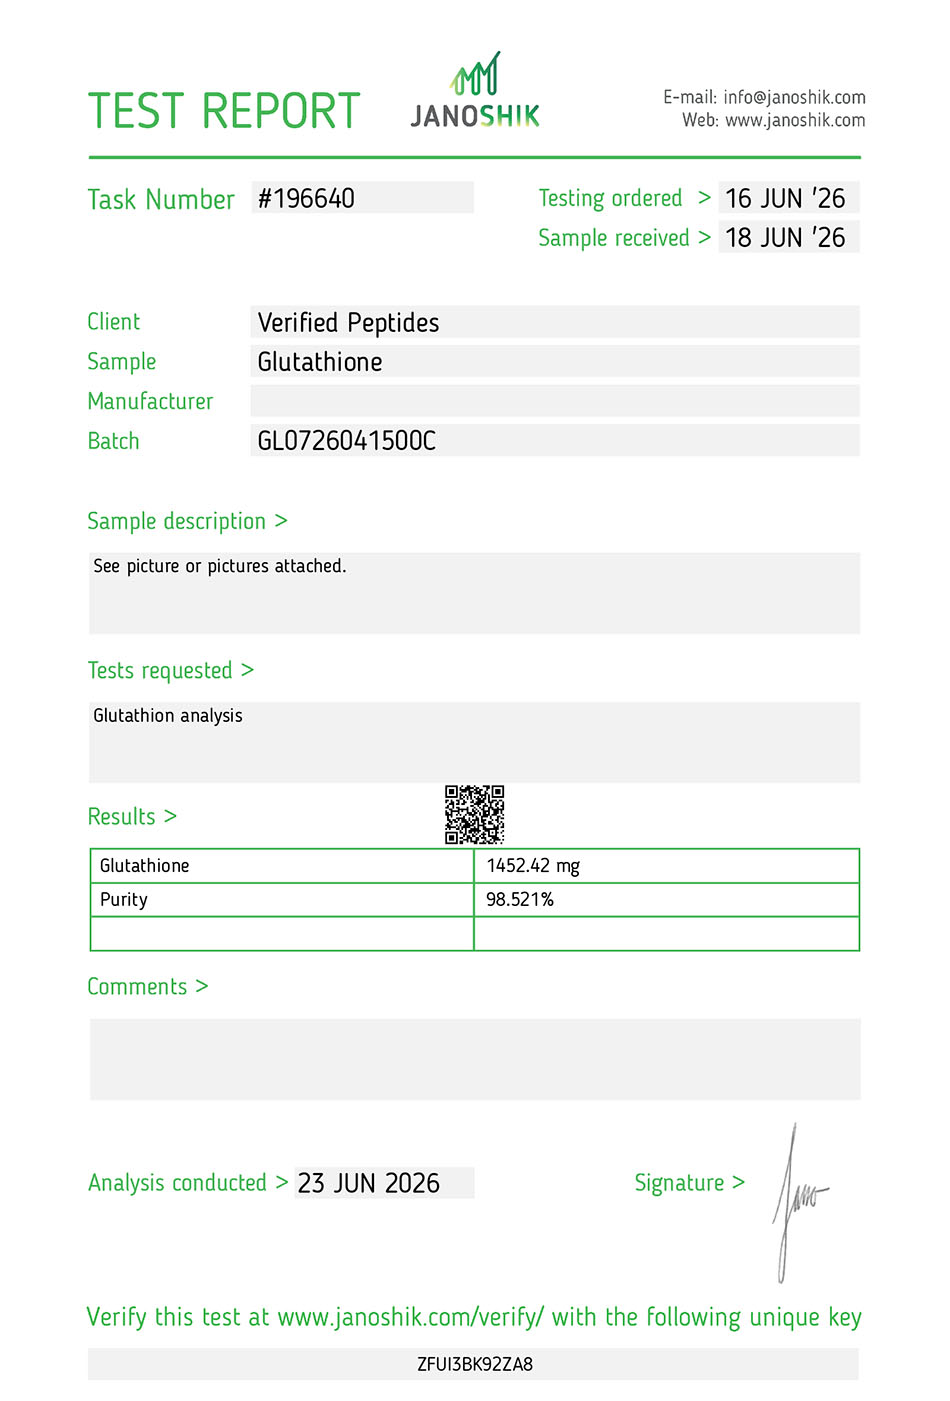
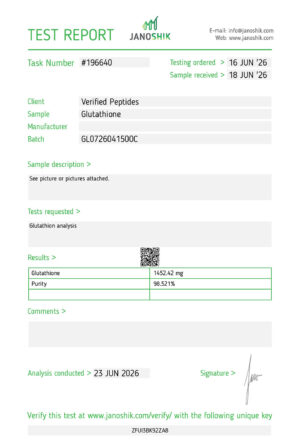
| Purity: | 99.521% |
| Weight: | 1452.42mg |
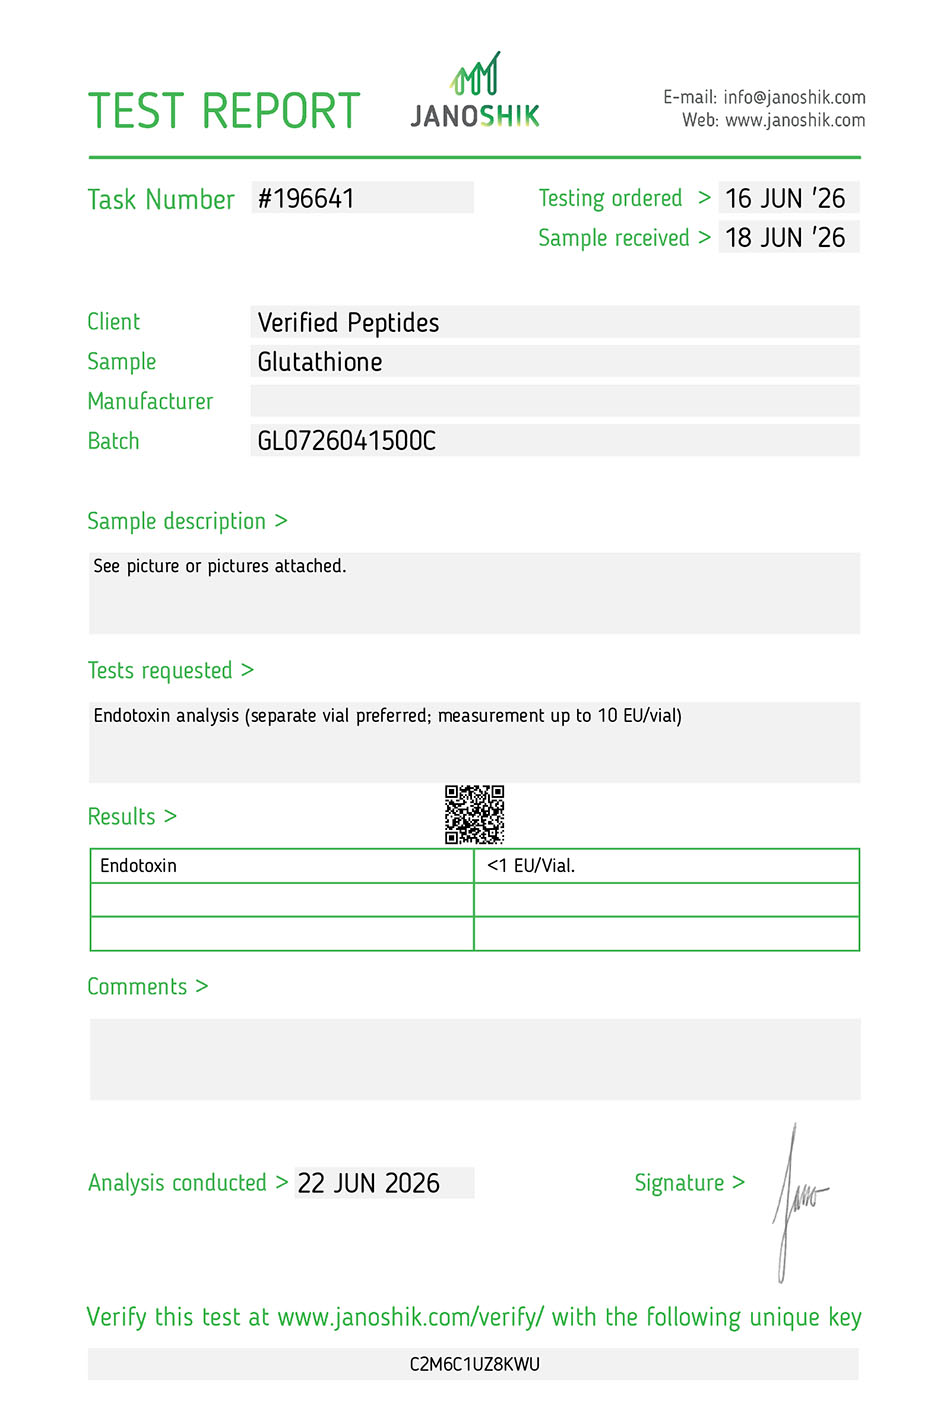
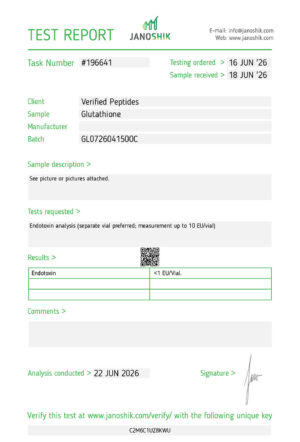
| Endotoxins (LPS): | Pass |
| Batch #: | GL0726041500C |
| Testing Lab: | Janoshik |
| COA Verified Link: | Purity Report Endotoxin Report |
| Testing Methods: | HPLC, LAL, TAMC/YAMC USP <71> |
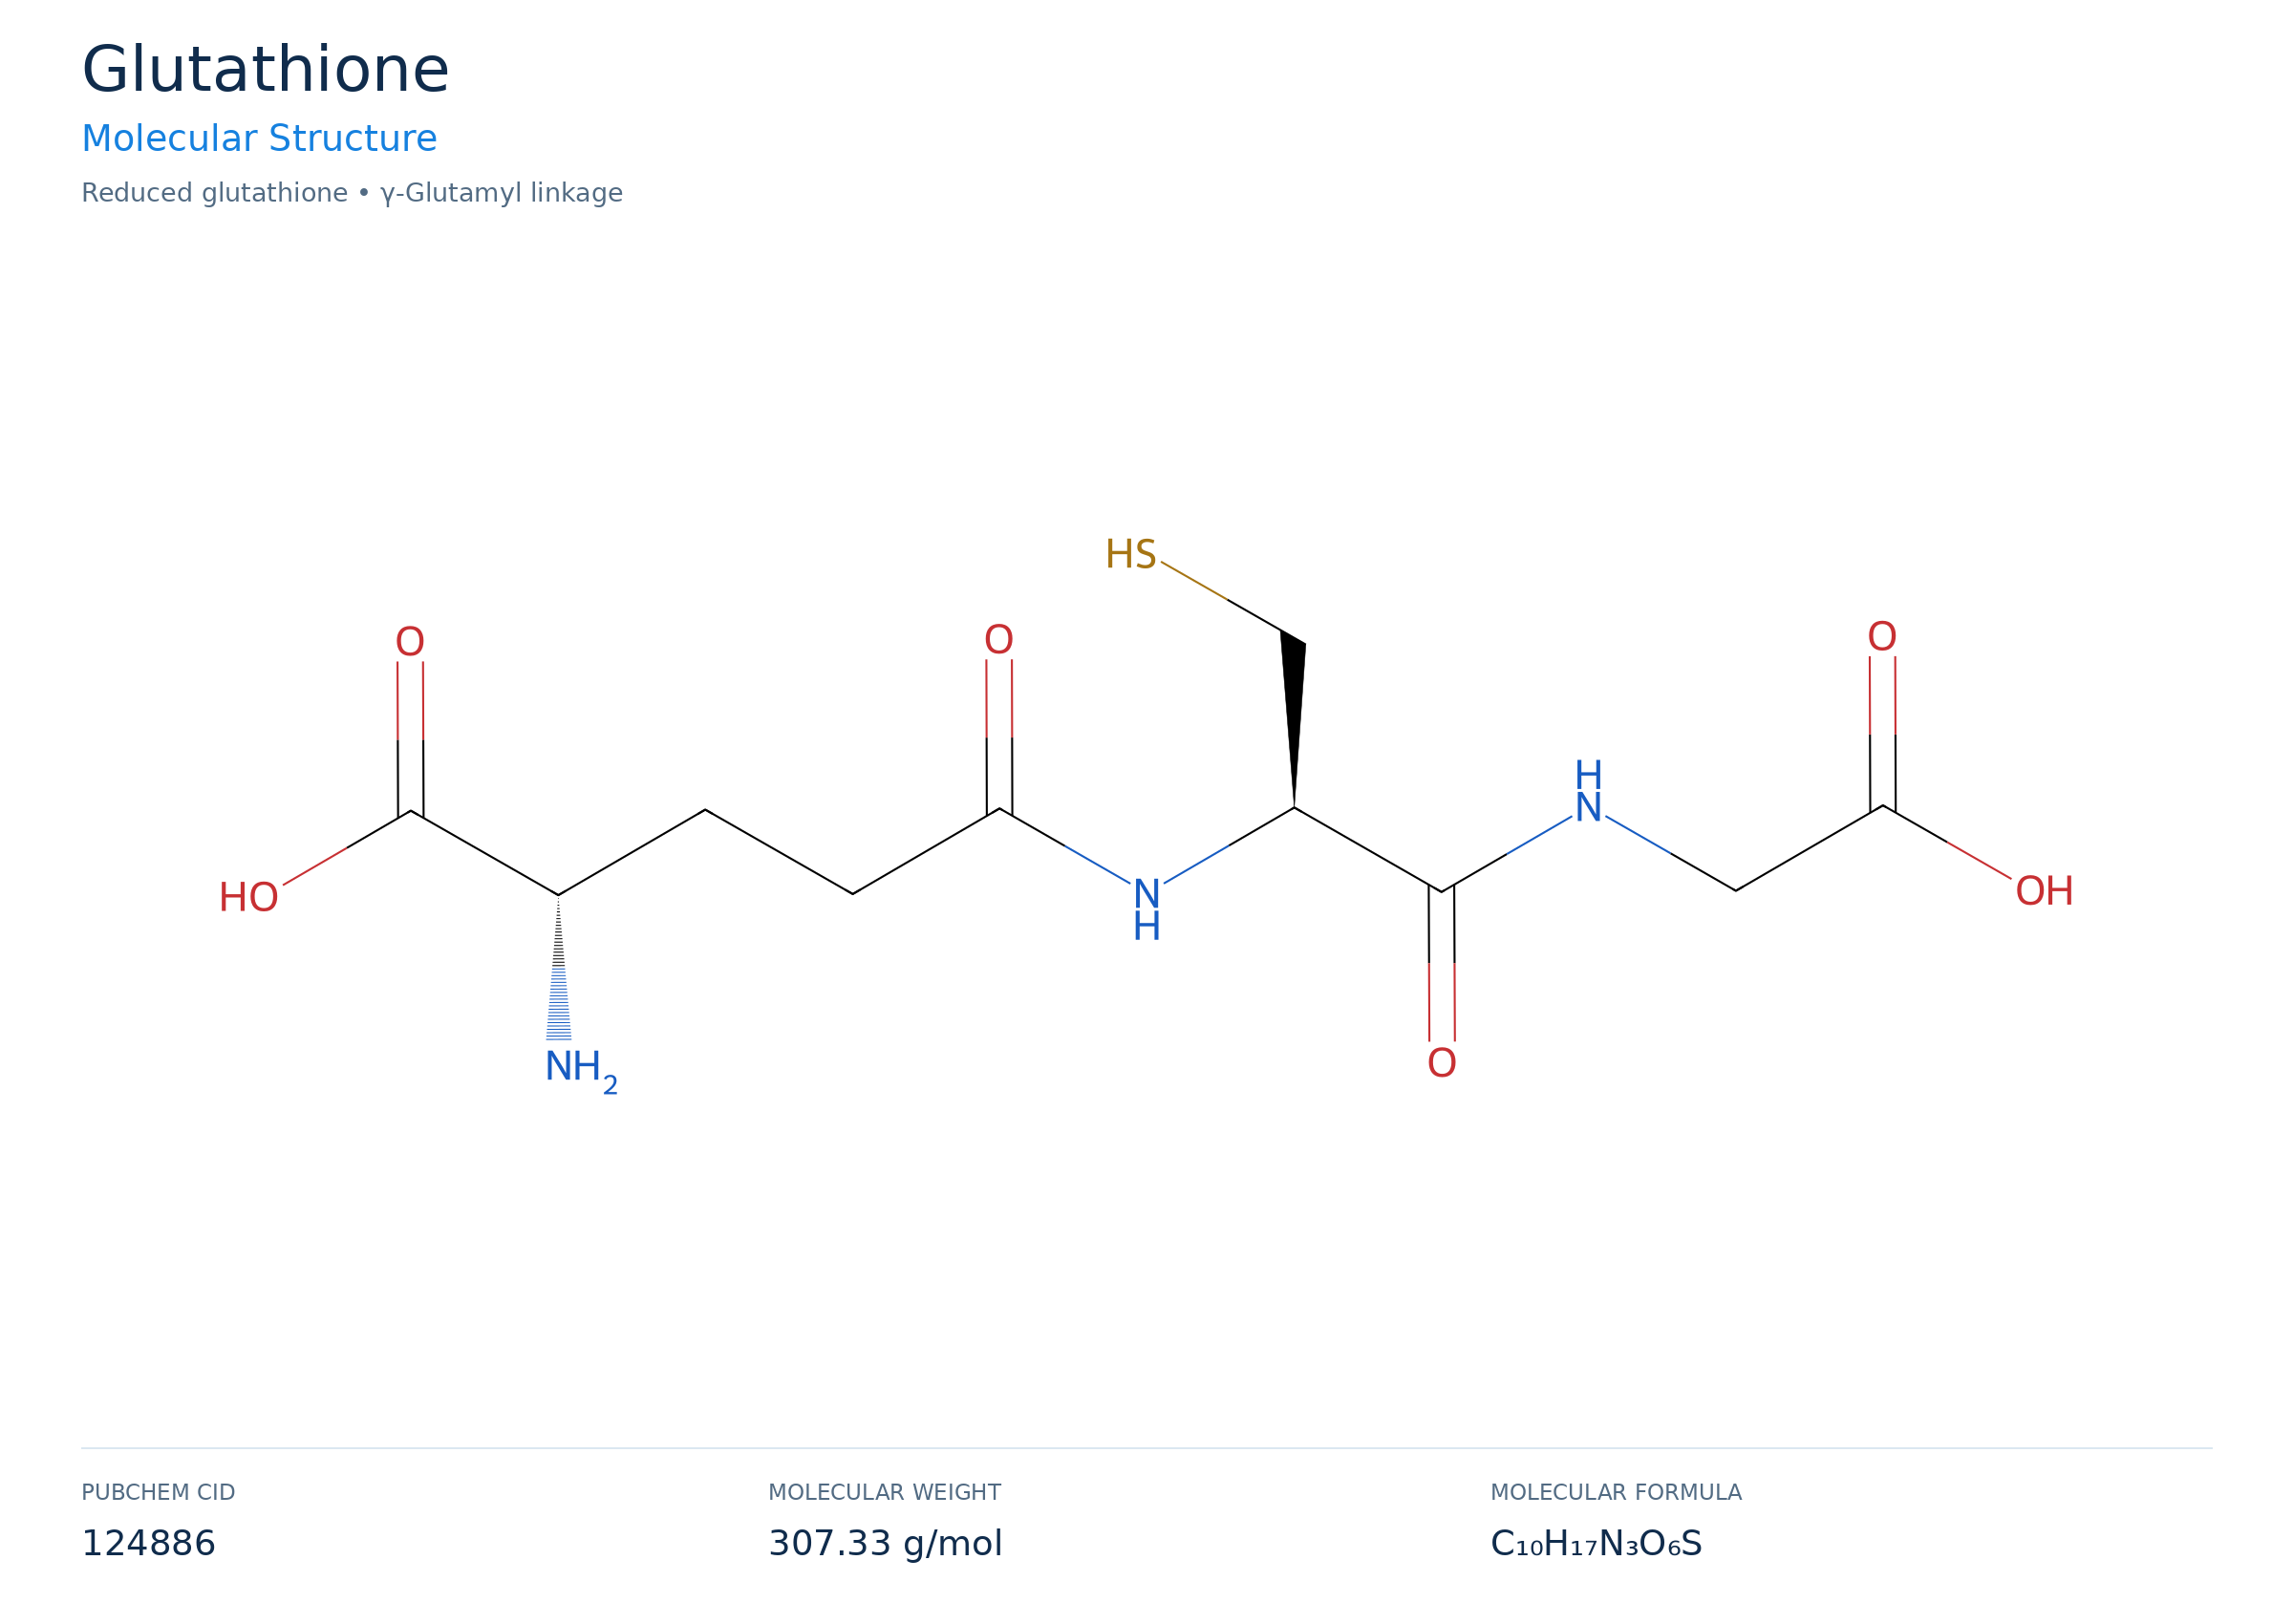
Glutathione Specifications: Molecular Weight, CAS Number & Sequence
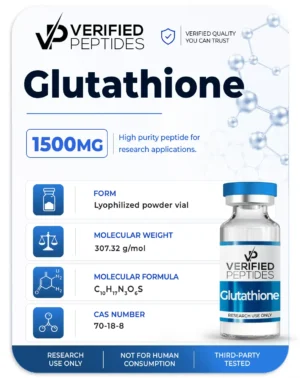
Glutathione (CAS 70-18-8) is a tripeptide with the molecular formula C10H17N3O6S and a molecular weight of 307.32 g/mol.
| Form: | Powder (lyophilized) |
|---|---|
| Weight: | 1500mg |
| Appearance: | White crystalline powder |
| CAS Number: | 70-18-8 |
| Molecular Formula: | C10H17N3O6S |
| Molecular Weight: | 307.32 g/mol |
| PubChem CID: | 124886 |
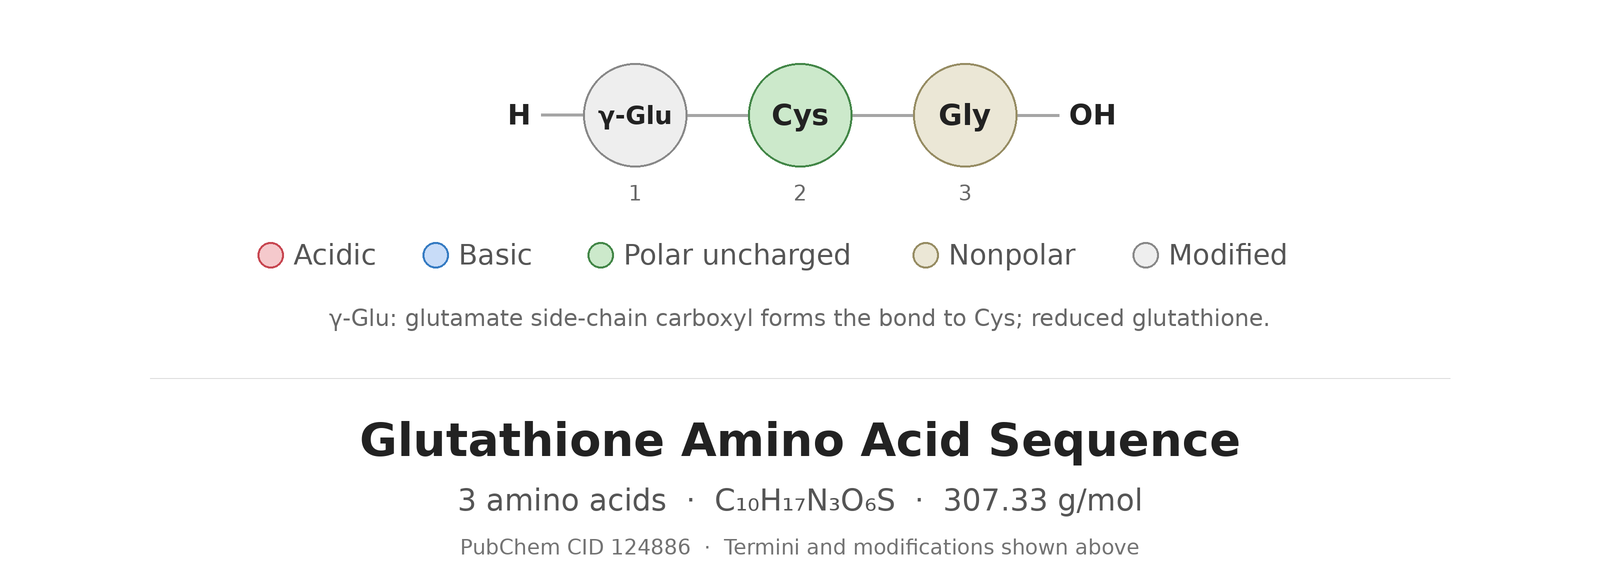
| Sequence: | γ-Glu-Cys-Gly |
| Other Names: | Glutathione, L-Glutathione (Reduced), GSH, γ-L-Glutamyl-L-cysteinylglycine |
| Terms: | Subject to our Terms and Conditions. This material is sold for laboratory research use only. Not for human consumption, animal, or medical use. |
Glutathione Molecular Structure
Glutathione Amino Acid Sequence

The industry's most trusted source for research peptides
The #1 Leader In Peptide Testing
500+ Certificates of Analysis
What does this mean for you? You can be sure we don't cut corners on testing every single batch.
Visit our Lab Reports page.
A Long Standing Trusted Company
6+ Years of Peptides
We pioneered third party lab testing and have stood the test of time. Our first lab report dates back to 2019 proving our track record.
The Best $/mg Prices At The Highest Quality
You won't find this degree of testing and quality at this price.
Peptides Tested For More Than Just Purity
We conduct an array of tests via HPLC and other methods for our peptides:
purity, weight, endotoxins(LPS), sterility (bacteria & mold/yeast), and TFA content.
Transparency. Trusted. Reliable.
- Batch number on every vial
- Published Certificates of Analysis
- Expert customer service
- Satisfaction and quality guarantee
- Cold pack styrofoam shipping
Explore Other High-Purity Peptides
Peptide Blends
Price range: $65.00 through $107.00
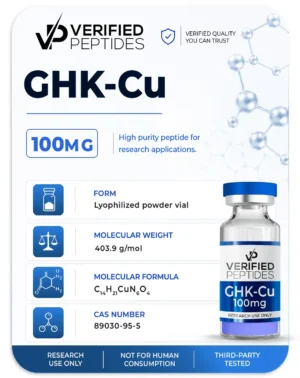
Peptides
$49.99
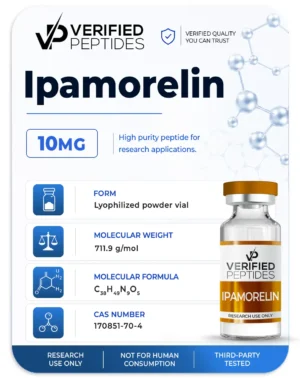
Peptides
$44.99
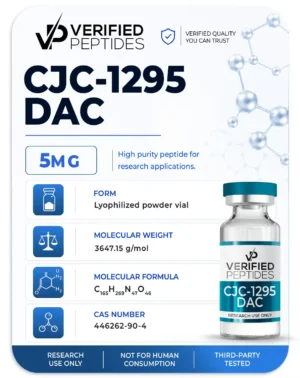
Peptides
$41.99
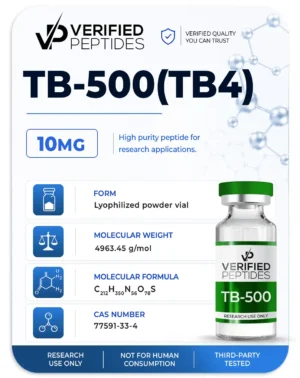
Peptides
$62.00
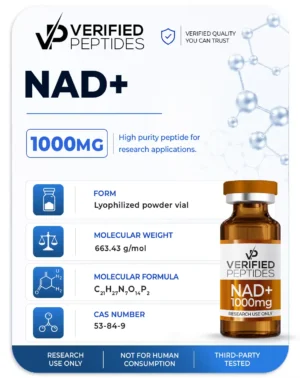
Peptides
$119.00
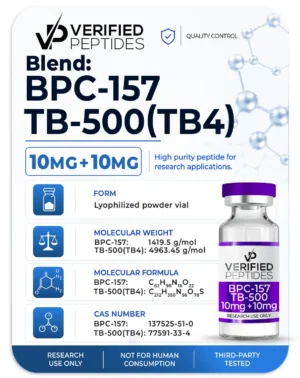
Peptide Blends
$107.00
● Animal Model Research Review
Glutathione Rat Study: Vitamin C Plus Glutathione and Oxidative Stress Markers in Aged Rats (Amer, 2002)
This page summarizes a small 2002 study in 18-month-old male rats. It tested a daily oral combination of vitamin C and glutathione (GSH), a naturally occurring tripeptide, for 6 weeks. The researchers measured oxidative stress markers, tissue glutathione, serum lipids, hormones and trace minerals. Because the two compounds were always given together, the results cannot be attributed to glutathione alone.
What Is Glutathione?
Glutathione (GSH) is a tripeptide made by cells from glutamate, cysteine and glycine. In its reduced form, it acts as a substrate for the enzymes glutathione peroxidase and glutathione-S-transferase, which take part in neutralizing reactive oxygen species and detoxifying compounds. Researchers often study tissue glutathione as one marker of a cell's antioxidant status.
● Why vitamin C was included
The author cited earlier work suggesting that ascorbic acid (vitamin C) may help reduce disulfide bonds and support glutathione reductase, the enzyme that regenerates reduced GSH from its oxidized form (GSSG). The mixture was designed around this proposed interaction.
Study Objective
The study asked whether a combination of vitamin C and GSH, given to older rats, would change tissue lipid peroxidation, tissue GSH, serum lipids, testosterone, thyroid hormones (T3 and T4), and copper and zinc levels. All comparisons were made between treated and untreated rats of the same age.
How the Rat Study Was Designed
The study used 18-month-old male Sprague–Dawley rats weighing 500–550 g. Rats were split into two groups of five. One group was an untreated control. The other received a mixture of GSH (100 mg/kg body weight) and vitamin C (30 mg/kg body weight) by stomach tube (intragastrically) once daily for 6 weeks. These amounts describe the published rat protocol only. At the end of the study, blood, liver, testes and brain were collected for analysis.
▲ Study at a glance
Citation: Amer MA. Ann Nutr Metab. 2002;46:165–168.
Animals: Male Sprague–Dawley rats, 18 months old, 5 per group
Intervention: GSH plus vitamin C combined, by stomach tube daily for 6 weeks, compared with untreated controls of the same age
Oxidative stress: TBARS (thiobarbituric acid-reactive substances), a marker of lipid peroxidation, in liver and testes
Tissue antioxidant status: GSH in liver and testes
Serum: Testosterone, T3, T4, cholesterol, triglycerides
Trace minerals: Copper (Cu) and zinc (Zn) in serum, liver, brain and testes
What Did the Glutathione Study Find? Oxidative Stress Markers
TBARS and Tissue GSH
Compared with untreated rats, the supplemented group had significantly lower TBARS in both liver and testes, which the author interpreted as lower lipid peroxidation.
Tissue GSH Differed by Organ
Testicular GSH was significantly higher in the supplemented group. Liver GSH was essentially unchanged. This organ-specific pattern means the lower liver TBARS did not come with higher liver GSH.
| Parameter | Tissue | Control (Mean ± SE) | Supplemented (Mean ± SE) | Significance |
|---|---|---|---|---|
| TBARS (nmol/g) | Liver | 3,933 ± 298.8 | 2,546 ± 148.3 | p < 0.05 ↓ |
| TBARS (nmol/g) | Testes | 3,160 ± 318.8 | 1,164 ± 70.49* | p < 0.05 ↓ |
| GSH (µmol/g) | Liver | 1.83 ± 0.01 | 1.84 ± 0.08 | Not significant |
| GSH (µmol/g) | Testes | 0.65 ± 0.02 | 1.95 ± 0.09 | p < 0.05 ↑ |
Values from Table 1 of the paper (n = 5 per group). *Printed as "1.164" in the original table. It is shown here as 1,164, assuming the same units as the other values.
Serum Lipids and Hormone Measurements
Serum cholesterol and triglycerides were significantly lower in the supplemented group. Serum testosterone was significantly higher. The author proposed that this related to lower oxidative stress and higher GSH in the testes, but the study did not test that link directly. Serum T3 and T4 did not differ significantly between groups.
| Serum Parameter | Control | Supplemented | Significance |
|---|---|---|---|
| Testosterone (ng/dL) | 75.8 ± 4.3 | 113.68 ± 6.2 | p < 0.05 ↑ |
| T3 (ng/dL) | 0.9 ± 0.07 | 0.92 ± 0.06 | Not significant |
| T4 (ng/dL) | 5.0 ± 0.33 | 4.52 ± 0.48 | Not significant |
| Cholesterol (mg/dL) | 84.4 ± 2.9 | 67.4 ± 1.8 | p < 0.05 ↓ |
| Triglycerides (mg/dL) | 105.68 ± 4.34 | 86.26 ± 4.6 | p < 0.05 ↓ |
Values from Table 2 of the paper, as printed, with units as reported by the author (n = 5 per group).
Copper and Zinc Measurements
Copper was significantly higher in the supplemented group in serum, liver, brain and testes. Zinc was significantly higher in serum and brain. Liver and testis zinc did not differ significantly. The paper's abstract says zinc rose in the testes, but its results table and text report no significant change there, so this summary follows the table.
| Mineral | Compartment | Control | Supplemented | Significance |
|---|---|---|---|---|
| Zn (µg/mL) | Serum | 2.31 ± 0.19 | 4.59 ± 0.57 | p < 0.05 ↑ |
| Zn (µg/g) | Liver | 14.953 ± 1.38 | 11.983 ± 0.73 | Not significant |
| Zn (µg/g) | Brain | 14.93 ± 0.662 | 20.591 ± 0.59 | p < 0.05 ↑ |
| Zn (µg/g) | Testes | 26.704 ± 0.76 | 29.69 ± 1.36 | Not significant |
| Cu (µg/mL) | Serum | 1.19 ± 0.24 | 1.84 ± 0.14 | p < 0.05 ↑ |
| Cu (µg/g) | Liver | 2.136 ± 0.05 | 2.487 ± 0.057 | p < 0.05 ↑ |
| Cu (µg/g) | Brain | 2.137 ± 0.13 | 3.741 ± 0.29 | p < 0.05 ↑ |
| Cu (µg/g) | Testes | 1.931 ± 0.09 | 2.737 ± 0.22 | p < 0.05 ↑ |
Values from Table 3 of the paper (n = 5 per group).
The Author's Interpretation: Antioxidant Recycling
The author proposed that giving vitamin C with GSH may support an antioxidant "recycling" pathway, in which vitamin C helps regenerate reduced glutathione. This was presented as the rationale for the combination and as one interpretation of the results. The study did not measure glutathione reductase activity, oxidized glutathione (GSSG) or vitamin C levels, so the mechanism was not tested directly.
Limitations and Research Context
This is a small, short study, and several features limit what it can show:
- Only 5 rats per group, all male, of one strain and age.
- Glutathione was always given with vitamin C, so neither compound's separate contribution can be determined.
- There was no young control group, so the study could not show whether the measures were "age-related" or whether supplementation moved them toward younger values.
- Administration was by stomach tube, which differs from other routes. Results may not apply to other forms, routes or amounts.
- The paper reports a single experiment, with one inconsistency between its abstract and results (testicular zinc) and one apparent typographical error in Table 1.
- Findings in rats do not establish effects, safety or dosing in people.
Conclusion
In Amer (2002), 18-month-old male rats given a daily oral combination of vitamin C and glutathione for 6 weeks had lower TBARS in liver and testes, higher testicular GSH, lower serum cholesterol and triglycerides, higher serum testosterone, and higher copper and zinc in some tissues than untreated rats of the same age. T3, T4 and liver GSH did not change. Because of the very small groups, the combined intervention and the lack of a young comparison group, these results are preliminary.
At a Glance: What Changed vs. What Didn't (Supplemented vs. Untreated Aged Rats)
↓
TBARS (Liver)
Significantly lower
↓
TBARS (Testes)
Significantly lower
↑
Testis GSH
Significantly higher
↔
Liver GSH
No significant difference
↓
Cholesterol
Significantly lower
↓
Triglycerides
Significantly lower
↑
Testosterone
Significantly higher
↔
T3 & T4
No significant difference
↑
Copper (Cu)
Higher in serum, liver, brain and testes
↑
Zinc (Zn)
Higher in serum and brain; no significant change in liver or testes
Frequently Asked Questions
What is glutathione, and why is it called a tripeptide?
Glutathione (GSH) is made of three amino acids: glutamate, cysteine and glycine. That three-amino-acid structure makes it a tripeptide. It acts as a substrate for glutathione peroxidase and glutathione-S-transferase.
What did the 2002 vitamin C and glutathione rat study find?
In 18-month-old male rats given vitamin C plus GSH by stomach tube daily for 6 weeks, TBARS were lower in liver and testes, testicular GSH was higher, and serum cholesterol and triglycerides were lower than in untreated rats of the same age. Testosterone was higher, and T3 and T4 were unchanged.
Did the study test glutathione on its own?
No. GSH was always given together with vitamin C, so the study cannot separate the effects of glutathione from those of vitamin C.
What is TBARS, and what does it measure?
TBARS (thiobarbituric acid-reactive substances) is a laboratory assay for products of lipid peroxidation. It is commonly used as an indirect marker of oxidative damage to cell membranes in tissue samples.
Did tissue glutathione rise in every organ?
No. Testicular GSH rose from about 0.65 to 1.95 µmol/g, while liver GSH was essentially unchanged (1.83 vs 1.84 µmol/g).
What are the main limitations of this study?
The study used 5 male rats per group, combined GSH with vitamin C, gave it by stomach tube for only 6 weeks, and had no young control group. The findings are preliminary and do not establish effects, safety or dosing in people.
Important disclaimer: All findings on this page come from a single preclinical study (Amer, 2002) in 18-month-old male Sprague–Dawley rats given a combination of vitamin C and glutathione. This summary is provided for research and educational purposes. Statements on this page have not been evaluated by the FDA. Research compounds offered on this site are for laboratory research use only. They are not intended for human or veterinary use, or to diagnose, treat, cure, mitigate or prevent any disease.
Source: Amer, M.A. (2002). Modulation of Age-Related Biochemical Changes and Oxidative Stress by Vitamin C and Glutathione Supplementation in Old Rats. Annals of Nutrition & Metabolism, 46, 165–168. DOI: 10.1159/000065402
https://doi.org/10.1159/000065402
https://doi.org/10.1159/000065402