
Decoding Lab Reports: Peptide Verification Report Metrics
Author: Dr. Numan S. Date: August 21, 2025
Why Lab Reports Matter in Peptide Research
Laboratory reports (such as Certificates of Analysis) accompany synthesized peptides and are crucial for ensuring the material is what you expect. Peptides are complex molecules, and even small impurities or sequence errors can lead to misleading experimental results. If a peptide’s identity or purity is wrong, downstream assays—ranging from enzymatic reactions to cell culture or protein identification studies—may yield false conclusions. Verifying the provided peptide report metrics helps safeguard against wasting time on faulty reagents.
Real-world cases underscore the importance of scrutinizing these reports. In one analysis of research-grade peptides, only 44% of samples met the ≥95% purity specified by the supplier, and one peptide turned out to be an entirely different sequence altogether [1]. Similarly, an earlier study examining peptides from multiple manufacturers found that one product was actually the wrong peptide, and two-thirds of the samples were of insufficient purity (under 95%) for reliable in vitro or in vivo experiments [1]. Such examples highlight that without proper quality control, peptide impurities or misidentification can derail research. Indeed, impurities in peptide preparations have been linked to irreproducible results and even false-positive findings in sensitive applications [1]. Therefore, thorough review of lab report data is not just a formality – it’s essential for amino acid–based research integrity.
Key Report Metrics to Look For
When reviewing a peptide’s analytical report or CoA, pay attention to several key report metrics that indicate quality and consistency [3]. Other metrics or notes may appear as well (e.g. solvent content, optical rotation for chiral purity, or confirmation of specific modifications). In general, these peptide report metrics collectively give a snapshot of quality, and each should be evaluated against the requirements of your experiment.
- Purity (%) by HPLC: The percentage of the target peptide versus any impurities, typically determined by reverse-phase high-performance liquid chromatography. Higher is better – for example, ≥90–95% purity is often recommended for peptides used in critical biological assays [3]. This assures that contaminating peptides (truncated or incorrect sequences) are minimal.
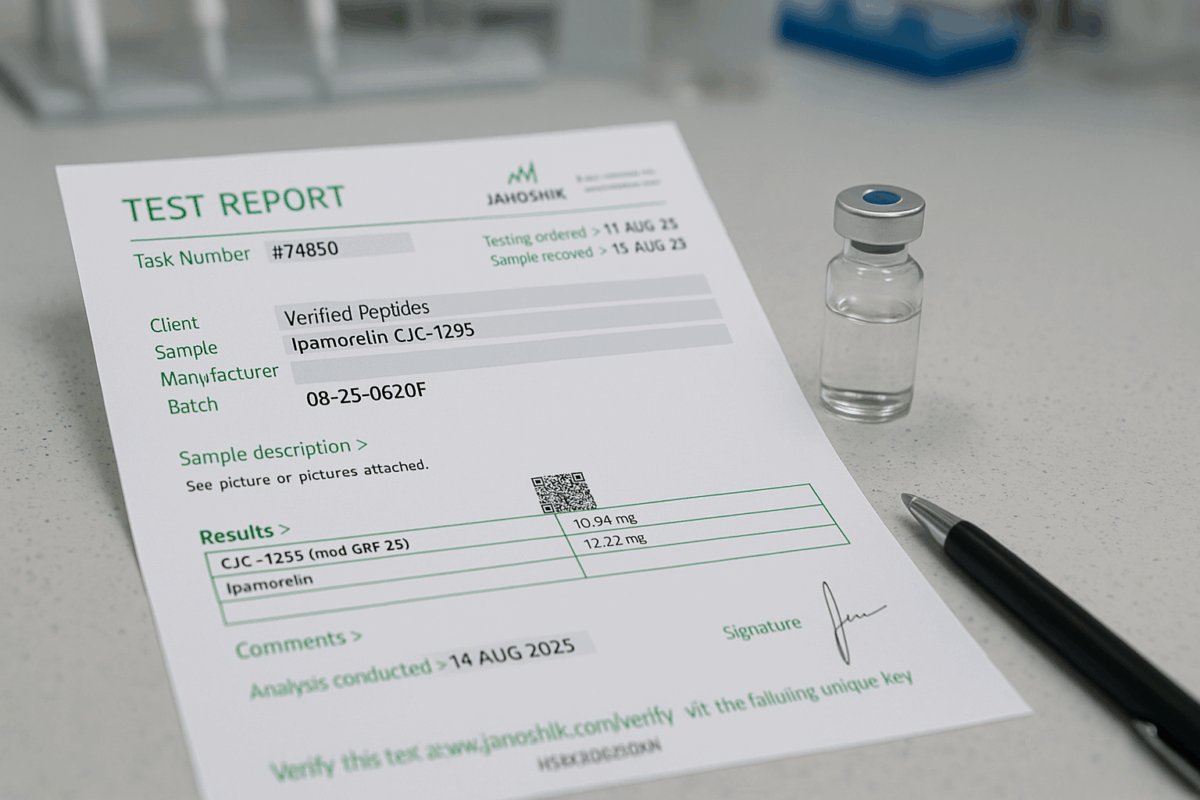
Figure 1: Verified Peptide Lab Report
- Molecular Weight / Identity (Mass Spectrometry): A confirmation of the peptide’s molecular weight using mass spectrometry (MS). The observed mass (often given as an [M+H]^+ value) should match the theoretical mass calculated from the sequence (within a small error margin). This verifies the peptide’s identity and sequence (to the extent of confirming all expected amino acids are present).
- Endotoxin Level: For peptides intended for cell culture or animal use, check if an endotoxin test was performed. Endotoxins (bacterial LPS contamination) can cause inflammation or interfere with experiments. Some suppliers provide peptides with endotoxin levels below a strict threshold (e.g. <0.01 EU/μg) for sensitive assays [5]. Low endotoxin is critical for in vivo research or immunological experiments.
- Sterility Testing: If the peptide will be used in sterile applications (such as injections or cell work), a sterility test ensures no viable microbial contamination. GMP-grade peptides (used for clinical or pharmaceutical purposes) are typically sterile and tested for bioburden, whereas research-grade peptides are not [3].An absence of sterility assurance in the report means the peptide is for research use only and not free of microbes.
- Amino Acid Analysis (AAA) / Composition: Some reports include AAA data confirming the peptide’s composition. AAA hydrolyzes the peptide and quantifies its constituent amino acids, verifying the presence of each residue and allowing calculation of net peptide content. Consistency with the expected composition supports correct peptide identification.
- Net Peptide Content: Often given as a percentage, this indicates the fraction of the material that is actual peptide, excluding water, salts, or counter-ions. A peptide sample may be, for example, 75% peptide by weight with the rest being water and counter-ions. Net content is determined by elemental analysis or AAA and is important for accurate dosing (it differs from purity, which is about which peptides are present) [3].
Other metrics or notes may appear as well (e.g. solvent content, optical rotation for chiral purity, or confirmation of specific modifications). In general, these peptide report metrics collectively give a snapshot of quality, and each should be evaluated against the requirements of your experiment.
Understanding Purity and Impurities
High-performance liquid chromatography (HPLC) is the workhorse method for peptide purity determination. HPLC purity is defined as the percentage of the desired peptide in the sample relative to all other UV-absorbing species at the detection wavelength (typically ~210–220 nm). In practical terms, a single dominant peak on the chromatogram indicates a high-purity peptide, whereas additional peaks reveal the presence of impurities. The example above shows an almost perfectly pure product, whereas a less pure sample might display several peaks of significant area. The mass range and retention times of impurity peaks can vary depending on their nature, but ideally each impurity should be very minor in proportion to the main peak.
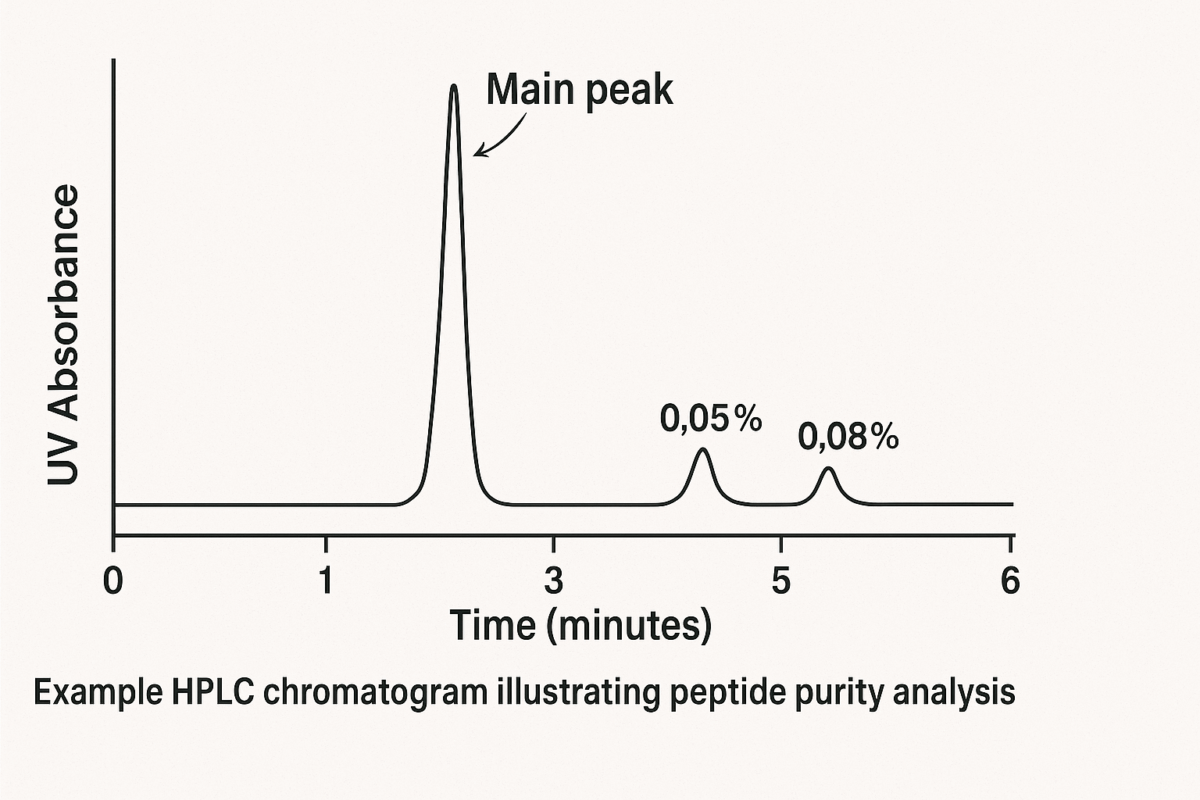
Figure 2: Example HPLC chromatogram illustrating peptide purity analysis.
Even when a peptide is high-purity (e.g. >95%), understanding the remaining impurities is important. Common impurities in synthetic peptides include truncated or “deletion” sequences (peptides missing one or more amino acid residues), peptides with incomplete deprotection (protecting groups still attached), and byproducts of side reactions during synthesis [4]. For instance, deletion of an amino acid or incomplete removal of a protecting group will produce a variant with a different mass and possibly a different retention time; Asn residues can undergo deamidation (a chemical change akin to a post translational modification) either during synthesis or on storage, converting to Asp and adding a mass of +1 Da [4]. These impurities are usually present in very small amounts if the peptide was well-purified, but if present in larger amounts they can compete with or mask the behavior of the target peptide. It’s also important to distinguish between “purity” and “peptide content.” Purity refers to the relative distribution of peptide species (as determined by HPLC area percentages), whereas net peptide content refers to how much of the material is peptide versus non-peptide matter like water and counter-ions [3]. For example, a peptide could be 98% pure (virtually no alternate peptides present) yet have a net content of 70% if the lyophilized powder contains a lot of water and salts. Both factors matter: purity for ensuring no significant contaminant peptides, and net content for calculating correct concentrations.
Interpreting Mass Spectrometry & Chromatography Data
Mass spectrometry plays a central role in peptide identification and quality verification. The mass spectrometry data provided in a peptide’s report typically lists the observed molecular mass (often as an m/z value for the singly protonated ion). This observed mass should closely match the theoretical mass of the peptide (within instrument error). Modern MS instruments offer high accuracy (often within a few parts per million) across a broad mass range – for example, electrospray MS might scan up to ~3000 Da, comfortably covering typical peptide sizes [6]. A match between the observed and expected mass confirms that the peptide’s amino acids are all present in the correct quantity (no major truncations or additions). Always verify the charge state: in MALDI-TOF MS, the primary peak is usually [M+H]^+, while ESI may show multiple charge states (e.g., [M+2H]^2+). The report might explicitly state the found molecular weight; if it differs from the calculated weight by more than a small margin, that’s a serious concern.
Interpreting mass spectrometry data requires recognizing normal artifacts versus true discrepancies. For instance, it is common to see small secondary peaks corresponding to sodium or potassium adduct ions ([M+Na]^+ or [M+K]^+), which arise from salts in the sample [3]. These are not impurities in sequence, just different ion forms of the same peptide, and their presence (usually at much lower intensity than the main [M+H]^+ peak) is expected. On an MS spectrum printout, you might also see isotope clusters – a peptide of a given mass will show a cluster of peaks (due to ^13C, ^15N isotopes), which is normal. However, an entirely unexpected major peak (with a mass that doesn’t correspond to the target peptide or a simple adduct) is a red flag – it could indicate the presence of an alternate peptide or a significant contaminant. In such cases, further investigation with MS/MS (tandem MS sequencing) might be warranted to determine what that extra peak is.
Chromatography data should be examined in tandem with MS data. The HPLC chromatogram (as discussed in the purity section) tells you how many components are in the sample and their relative amounts. If the lab report provides a chromatogram or peak listing, look at the number of peaks and the purity percentage. A single peak comprising ~95–99% of the area is ideal. Any additional peak of substantial area (say a few percent or more) means an impurity is present; you might check if the report’s MS analysis addressed those impurity peaks (advanced analyses sometimes include LC-MS where each peak is analyzed by MS to identify impurities [4]). In sum, use the mass spectrometry data to confirm identity and the chromatography to confirm purity – together, these metrics ensure that the peptides identified in your sample are indeed the correct ones and mostly free of variants.
It’s worth noting that in proteomics research, proper interpretation of mass spectra is critical for protein identification. When using peptides as part of a protein identification workflow, one relies on matching MS/MS fragment data to databases to identify peptides (and hence proteins). Misinterpretation (for example, not accounting for a post translational modification or a missed cleavage) can lead to false peptide identifications. Thus, whether you are verifying a purchased peptide or identifying peptides in a sample, careful analysis of MS data is essential. Always ensure that the peptides identified via mass spectrometry truly correspond to the intended sequence (for a purchased peptide, this means checking the MS against the expected formula; for a proteomic experiment, it means validating search results, especially for any unexpected modifications).
Additional Quality and Safety Metrics
Beyond purity and identity, additional report metrics may be provided to address quality and safety, especially for peptides used in biological systems. Endotoxin testing is one such metric. Endotoxins are lipopolysaccharide contaminants from bacterial sources that can co-purify with peptides (particularly if any biologically sourced reagents or water were used). Even trace endotoxin can induce significant immune responses or cell culture artifacts. Many research-grade peptides are not automatically screened for endotoxin, but if your application is sensitive (e.g., injecting the peptide into animals or using it with primary cells), you should either request an endotoxin test or ensure the supplier provides an endotoxin-controlled product. Some manufacturers offer special preparations with endotoxin levels guaranteed below 0.01 EU/μg [4], which is extremely low and suitable for most cell-based assays. The lab report may list an endotoxin level (in EU per mg or per mL); if this is absent, assume that no test was done and consider it a potential risk if your work is endotoxin-sensitive.
For peptides that need to be sterile (for example, clinical-grade or certain in vivo uses), sterility testing data should appear on the report. A sterility test (per USP <71> or similar) ensures no viable microbes are present in the peptide batch. Research-grade peptide shipments are generally not sterile. If the report does not mention sterility, you must sterilize the peptide (e.g., via filtration) before use in any cell culture or injection. On the other hand, GMP-grade (Good Manufacturing Practice) or API-grade peptides come with extensive documentation: they are produced in clean facilities and accompanied by sterility, endotoxin, and other safety tests [3]. The report for a GMP peptide (or an outsourced cGMP synthesis) will include these metrics. Always match the level of quality control to the needs of your research—using a non-sterile, endotoxin-laden peptide in an animal study, for instance, could confound results with toxicity or immune reactions not due to the peptide itself.
Other quality metrics that may be present in a peptide report include solvent content (e.g., residual acetonitrile or TFA), moisture content (sometimes measured by Karl Fischer titration for water percentage), and optical rotation or chiral purity (if the peptide has chiral centers and a specific rotation is expected for pure L-form, etc.). These are generally of secondary concern for most lab researchers, but they can matter in certain contexts (for instance, residual TFA salt might affect cell experiments, or a peptide with D-amino acids might have an optical rotation listed to verify its stereochemical composition). Amino acid analysis results, if provided, are useful for cross-checking the peptide’s composition and for determining the net peptide content as mentioned. If the peptide includes any special amino acid or modification (e.g., a phosphoserine, fluorescein label, or other post translational modifications in a biologically derived peptide), the report should confirm these – typically by noting it in the sequence and showing an MS mass shift or an additional analytical method (like UV spectrum for a fluorescent label). In short, take advantage of all the data given: each metric tells you something about the peptide’s quality or handling requirements.
Common Red Flags in Lab Reports
While reviewing peptide report metrics, keep an eye out for warning signs that something might be amiss with the quality or consistency:
- Low Purity for Intended Use: If the HPLC purity is far below what your application requires, it’s a red flag. For instance, only ~70% purity when you need a peptide for a bioassay (where typically >90% is suggested) should prompt concern. Impurities at that level could significantly affect experimental outcomes. In such cases, you might need to purify the peptide further or request a higher-purity batch.
- Mismatched or Strange MS Results: A major discrepancy between the expected molecular weight and the observed MS data is an immediate red flag. If the report’s mass spectrometry section shows a peak that doesn’t match your peptide (for example, a mass corresponding to a completely different sequence), the wrong peptide may have been delivered. Likewise, multiple strong peaks in the MS (aside from known adducts) suggest the sample might contain more than one peptide. This could indicate a synthesis mix-up or significant contamination. Peptide identification should be unambiguous – if the identity is in doubt, do not use the peptide until resolved.
- Missing Data: Absence of key analyses on a report can be telling. For example, if no MS data is provided at all, you have no confirmation of identity. Or if you ordered a modified peptide (say, biotinylated or phosphorylated) but the CoA does not explicitly confirm that modification (through MS or another test), that’s a problem. A proper CoA should document each intended modification or variant. A missing expected result is as much a red flag as a failing result.
- Batch-to-Batch Inconsistency: If you are ordering the same peptide multiple times, compare the CoAs. While some variation is normal, large differences in purity or content between batches can signal production issues. For instance, if one batch was 98% pure and the next is 85% pure, that’s unexpected without explanation. Similarly, a significant drop in net peptide content or a new impurity peak appearing in a later batch’s report is cause for inquiry. (Manufacturers acknowledge that some variability can occur despite consistent protocols [3], but any big change should be justified.)
- Out-of-Spec Results: Occasionally a CoA might include a result that fails the specification (e.g., purity below the guaranteed minimum, or a test that “does not conform”). This is rare if the product was released, but if you spot any notation that something is out-of-spec, clarify it. It could be a documentation error or an actual issue that slipped through.
Whenever a red flag is identified, it’s best to pause and investigate. Contacting the peptide supplier with questions about the report is often worthwhile – reputable companies will explain the data and may re-analyze or replace a peptide if there’s a verifiable issue. The goal is to catch these problems before the peptide is used in critical experiments. It is far better to resolve a purity or identity concern early than to troubleshoot inexplicable biological results later, only to discover an issue with the reagent.
Frequently asked questions (FAQs) about Peptide Verification Report Metrics
What are the most important report metrics in peptide verification?
- The most critical metrics include peptide purity percentage, molecular weight accuracy, identity confirmation, endotoxin levels, sterility test results, and the presence of residual solvents. Together, these values determine whether a peptide meets the quality standards necessary for reliable research outcomes.
How can researchers interpret purity percentages in lab reports?
- Purity percentages indicate the proportion of the sample that consists of the intended peptide compared to impurities. For research use, values above 95% are typically preferred, as lower percentages may suggest the presence of byproducts or degradation products that could interfere with experimental reproducibility.
What role do HPLC and mass spectrometry play in lab reports?
- High-performance liquid chromatography (HPLC) measures peptide purity by separating the target compound from impurities and quantifying their relative amounts. Mass spectrometry (MS), on the other hand, confirms the peptide’s molecular weight and structural integrity. Used together, these methods provide complementary data that verify both identity and purity.
Why is the Certificate of Analysis critical for peptides?
- The Certificate of Analysis (CoA) is an official document that summarizes all relevant quality tests performed on a peptide batch. It ensures transparency, confirms that the product has undergone independent or in-house validation, and provides researchers with confidence that the peptide meets stated specifications.
What red flags should researchers watch for in lab reports?
- Key warning signs include missing or incomplete data, purity levels significantly below 95%, inconsistent molecular weight readings, lack of third-party verification, and absent sterility or endotoxin testing. Any of these issues may signal compromised peptide quality, making the material unsuitable for reliable research.
References
- Verbeke F, et al. Quality evaluation of synthetic quorum sensing peptides used in R&D. J Pharm Anal. 2015;5(3):169-181pmc.ncbi.nlm.nih.gov.
- De Spiegeleer B, et al. Impurity profiling quality control testing of synthetic peptides: the obestatin case. Anal Biochem. 2008;376(2):229-234pubmed.ncbi.nlm.nih.gov.
- AAPPTec. Peptide Quality – FAQ. AAPPTec website. Accessed 2025peptide.com.
- Coffey A, Qin V. Analysis of a Synthetic Peptide and Its Impurities using MS-Compatible Mobile Phases with an Agilent AdvanceBio Peptide Plus column. Agilent Application Note 5994-2760EN; 2020agilent.com.
- GenScript. Peptide Endotoxin Control & Analysis Service. GenScript website. Accessed 2025genscript.com.
- Bachem. Quality Control of Amino Acids & Peptides: A Guide. Bachem AG; Accessed 2025interchim.fr.
- Iris Biotech GmbH. How to Decipher a Certificate of Analysis (CoA). Blog published June 5, 2025iris-biotech.de.