
Methods for Characterizing Peptide Aggregation
Author: Dr. Numan S. Date: September 25, 2025
What Is Peptide Aggregation?
Peptide aggregation refers to the process by which peptide molecules self-associate and clump together into larger assemblies. These aggregates can range from small soluble oligomers to insoluble deposits such as amyloid fibrils or amorphous precipitates [1]. Aggregation often occurs when peptides (or proteins) misfold or expose hydrophobic patches that stick to one another, forming non-native intermolecular contacts [1]. In other words, if a peptide loses its proper folded structure (e.g. due to mutation, stress, or intrinsic sequence traits), the exposed “sticky” regions tend to bind each other and nucleate aggregate formation. Common types of aggregates include amorphous aggregates, disordered clumps with no specific structure, and amyloid fibrils, highly ordered beta-sheet-rich fibers [1]. Notably, some peptides are intrinsically prone to aggregate due to their amino acid composition (for example, sequences rich in hydrophobic or β-sheet-forming residues). External conditions such as pH, temperature, peptide concentration, and agitation can further promote peptide aggregation by destabilizing the native state or encouraging peptide-peptide interactions.
Why Characterizing Peptide Aggregation Matters in Research
Understanding and characterizing peptide aggregation is critically important in both basic research and applied peptide development. In biomedical research, aggregate formation by peptides and proteins is implicated in numerous diseases. For example, the aggregation of amyloid-β peptides, tau, and α-synuclein into fibrillar plaques is a hallmark of Alzheimer’s and Parkinson’s disease [1]. These toxic aggregates can disrupt cellular function, so researchers study aggregation mechanisms to uncover therapeutic strategies. Even outside of disease contexts, uncontrolled peptide aggregation can confound laboratory experiments by causing loss of active peptide (e.g. precipitating out of solution) or by altering assay results. Many scientists in peptide research therefore routinely check for aggregation to ensure that the behavior of a peptide in solution is due to its monomeric form and not aggregate artifacts.
In peptide therapeutics and drug development, peptide aggregation is a major concern. Aggregates in a therapeutic peptide formulation can reduce its efficacy (since aggregated peptide is often biologically inactive) and even elicit adverse immune responses [2]. Indeed, protein/peptide aggregation is considered a significant bottleneck in the manufacturing and storage of biopharmaceuticals [3]. Aggregation can lead to instability of peptide drugs, shortened shelf-life, and potential safety issues. Therefore, pharmaceutical scientists devote substantial effort to characterizing and controlling aggregation during formulation. By thoroughly characterizing a peptide’s tendency to aggregate – and the conditions that influence aggregation – researchers can design better peptides (for example, by modifying sequences to reduce aggregation propensity) and select appropriate formulation conditions. In summary, measuring peptide aggregation is essential for ensuring reproducibility in research and for developing safe, effective peptide therapeutics.
Spectroscopic Techniques for Peptide Aggregation Analysis
Spectroscopic techniques are among the most widely used aggregation methods for initial peptide characterization. These methods leverage how peptides interact with light to infer structural changes or the presence of aggregates. Key spectroscopic techniques include UV–visible absorbance, fluorescence, and circular dichroism (CD), all of which are commonly available in biochemistry labs [2]. Together, these methods provide a quick and sensitive way to detect peptide aggregation. For example, a simple UV–vis turbidity measurement can reveal the formation of large insoluble aggregates: as peptides aggregate into particles, the solution becomes cloudy and absorbs/scatters light at wavelengths >320 nm (even though peptides themselves may not absorb there) [2]. Likewise, changes in the UV absorbance spectrum (250–300 nm region) can indicate altered environment of aromatic residues as aggregation progresses [2]. These optical signals serve as convenient proxies for aggregation state and are often the first line of peptide characterization in aggregation studies [2].
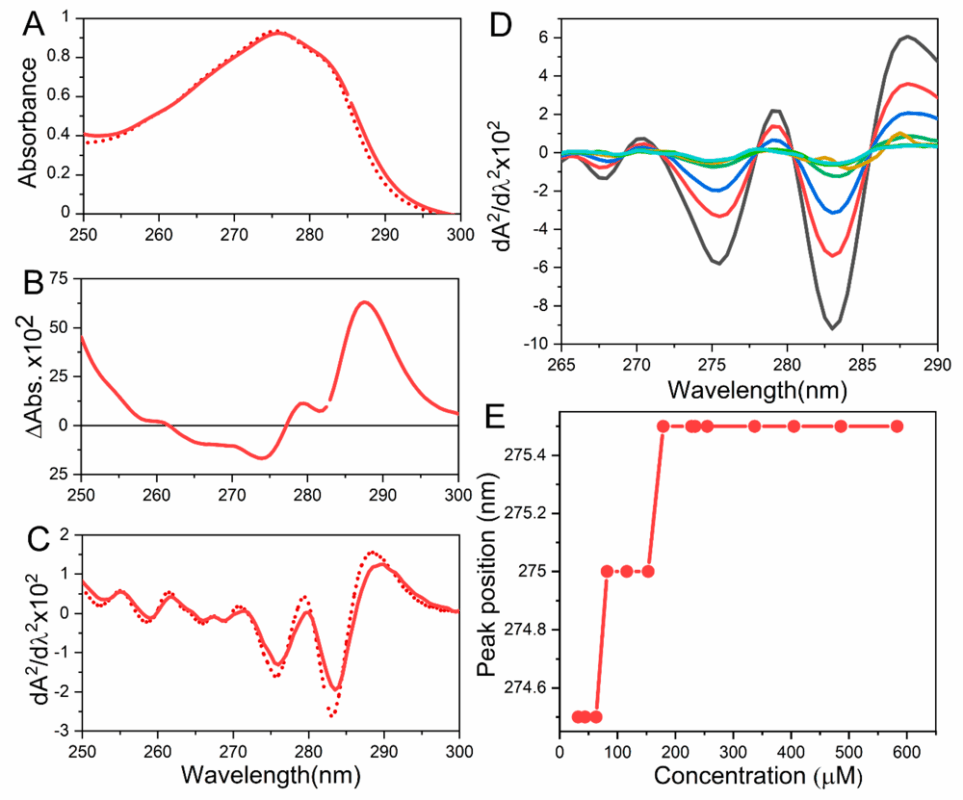
Figure 1: Example spectroscopic data showing changes in a peptide’s UV absorbance spectrum as it undergoes oligomerization and unfolding
Fluorescence-based assays are particularly popular for detecting peptide aggregates due to their high sensitivity. A classic example is the Thioflavin T (ThT) assay. Thioflavin T is a dye that exhibits weak fluorescence in solution but binds specifically to β-sheet-rich aggregate structures (such as amyloid fibrils) and then fluoresces strongly (with a characteristic emission around 480 nm) [2]. Thus, an increase in ThT fluorescence indicates the formation of amyloid-type aggregates. This assay is widely used to monitor kinetics of fibril formation in vitro by measuring fluorescence over time. Other fluorescent probes like Congo red, ANS (1-anilinonaphthalene-8-sulfonate), and newer environment-sensitive dyes have also been employed to detect aggregates by their spectral shifts or enhanced emission upon binding aggregated peptides [2]. Additionally, intrinsic fluorescence of certain amino acids can report on aggregation: for instance, tryptophan residues often fluoresce at a shorter wavelength (blue shift) in a hydrophobic, rigid environment – a shift that can occur when a peptide folds or aggregates and buries Trp in an ordered aggregate core.
Microscopy Methods to Visualize Aggregates
While spectroscopy infers aggregation indirectly, microscopy methods allow scientists to directly see peptide aggregates. Transmission electron microscopy (TEM) is a gold-standard technique to visualize the morphology of aggregates at the nanometer scale. Peptide and protein aggregates (especially amyloid fibrils) are often imaged by TEM after negative staining or cryo-EM preparation, revealing their size and shape [2]. For example, under TEM, amyloid fibrils appear as long, unbranched rope-like fibers, sometimes with twists, on the order of 5–15 nm in width and many hundreds of nanometers in length. TEM is extremely useful for confirming the presence of fibrils or other particulate aggregates in a sample [2]. A variation, cryo-electron microscopy (cryo-EM), allows imaging of aggregates in a near-native hydrated state and has even achieved atomic-level structural resolution for certain peptide fibrils in recent research. In addition to TEM, scanning electron microscopy (SEM) can be used for larger aggregate deposits, although SEM has slightly lower resolution for fine fibrils compared to TEM.
Another microscopy approach is atomic force microscopy (AFM), a type of scanning probe microscopy. AFM can visualize peptide aggregates by “feeling” the sample’s surface with a nanoscopic tip. It is particularly adept at imaging aggregates on a flat surface (like mica) and can measure their height profile. AFM has been used to measure the length distribution of amyloid fibrils and to observe amorphous aggregate clusters. It provides real-space topographical maps of aggregates without requiring staining – for instance, AFM images can show amyloid fibrils as raised rope-like structures on the surface, confirming their presence and linear morphology. Like TEM, AFM can distinguish between different aggregate morphologies (e.g. showing fibrils versus globular aggregates) in a peptide characterization study.
Biophysical Methods: Light Scattering and Calorimetry
Beyond spectroscopy and chromatography, various biophysical analysis tools are employed to assess peptide aggregation. One such staple is light scattering. Dynamic light scattering (DLS) measures the time-dependent fluctuations in laser light scattered by particles in solution to determine their size distribution. It is a quick, solution-based method requiring only a small sample. In the context of peptide aggregation, DLS is often used to monitor the growth of aggregates: an increase in the average particle size or the appearance of a large-size peak over time signifies aggregation [2]. For example, a monomeric peptide might have an apparent hydrodynamic diameter of a few nanometers, but once it aggregates into soluble oligomers or proto-fibrils, DLS might detect species with tens or hundreds of nanometers diameter.
DLS is very sensitive to even low amounts of large particles; however, this can also be a drawback – a tiny fraction of aggregates can dominate the scattering signal [2]. While DLS cannot resolve complex mixtures well, it is excellent for routine checks and for comparing aggregation propensities. A related technique, static light scattering, measures the absolute intensity of scattered light at multiple angles to yield molecular weight. Additionally, simple turbidity (optical density at a visible wavelength) is effectively a light-scattering measurement that can track aggregate formation in real time [2]. Light scattering methods thus provide a convenient, non-invasive way to quantify aggregate formation kinetics and extent.
Calorimetric techniques, especially differential scanning calorimetry (DSC), are valuable for assessing how aggregation affects a peptide’s thermal stability. DSC measures the heat flow required to raise the temperature of a sample, thereby detecting thermal transitions like protein unfolding. Many peptides exhibit an unfolding endotherm (melting transition) at a characteristic temperature (Tₘ). If aggregation accompanies or follows unfolding, the DSC thermogram can show additional features or irreversibility. For instance, an irreversible loss of the DSC baseline after a melt suggests that the peptide aggregates upon unfolding. DSC can even quantify the fraction of peptide that aggregates upon heating by analyzing the excess heat capacity curves [4].
A useful parameter is the refolding index, which compares how much protein refolds vs. how much is lost to aggregation after a full thermal cycle [4]. In this way, DSC links aggregation to thermodynamic stability – it answers questions like “At what temperature does this peptide start aggregating?” Another calorimetric method, isothermal titration calorimetry (ITC), can detect aggregation if exotherms occur upon peptide self-binding. Differential scanning fluorimetry (DSF), an assay related to DSC, uses a fluorescent dye to detect unfolding/aggregation (the dye binds exposed hydrophobic regions as the peptide unfolds and aggregates). This is often used in high-throughput screens to evaluate formulation conditions that minimize aggregation. Together, these calorimetric techniques contribute to a comprehensive biophysical analysis by tying aggregation behavior to thermodynamic properties like melting temperature and enthalpy [4].
Computational Tools for Modeling Aggregation
In the modern era, computational approaches are increasingly used alongside experiments to predict and model peptide aggregation. In silico tools can screen peptide sequences for “aggregation-prone” regions before any wet-lab experiments are done. Many algorithms have been developed that analyze amino acid properties (hydrophobicity, β-sheet propensity, charge patterns, etc.) to estimate a peptide’s tendency to aggregate [3]. For example, programs like TANGO, AGGRESCAN, and Zyggregator scan a peptide sequence and predict segments likely to initiate aggregation. Using such computational predictions, researchers in peptide research can redesign sequences to reduce aggregation. Some methods also evaluate how mutations affect aggregation propensity, valuable in protein engineering [3].
Challenges in Detecting and Characterizing Aggregates
Detecting and analyzing peptide aggregates is not without challenges. A sample might appear clear yet contain oligomers or nuclei below detection limits. Techniques like DLS may miss these “invisible” species, and microscopy may lack the sensitivity for nanometer-scale oligomers. Aggregation is also heterogeneous—a mix of monomer, oligomer, and fibril species can coexist. Ensemble methods often average these populations, obscuring detail [2].
Fluorescent probes and chromatography matrices can introduce artifacts. Thioflavin T, for example, may perturb aggregation or self-quench at high concentrations [2]. SEC can underestimate aggregates if they shear apart during flow. Because no single method gives a full picture, aggregation methods are used in combination—CD may reveal β-sheet structure, while TEM confirms fibrils. Integrating multiple orthogonal assays mitigates limitations [2,5].
Another challenge is in situ detection in biological systems. Most techniques require sample extraction or dilution, potentially disrupting aggregates. Emerging fluorescence-based tools aim to visualize aggregates directly in living cells [5]. Still, aggregation is dynamic and can evolve during measurement, requiring time-resolved monitoring.
In summary, the main difficulties include sensitivity limits, heterogeneity, artifacts, and capturing real-time dynamics. Researchers overcome these issues by combining complementary aggregation methods and proper controls, ensuring confidence in peptide aggregation data [2,5].
Conclusion: Selecting the Right Method for Peptide Studies
Peptide aggregation is multifaceted and demands diverse analytical strategies. Spectroscopic techniques (UV–vis, fluorescence, CD) are rapid for screening, while microscopy methods (TEM, AFM) confirm morphology. Chromatographic and biophysical analysis methods quantify aggregates, and computational tools predict
Frequently asked questions (FAQs) about Understanding Aggregation Analysis
What is peptide aggregation and why is it important to study?
- Peptide aggregation refers to the self-association of peptide molecules into larger ordered or disordered structures. Studying it is crucial because aggregation can alter a peptide’s solubility, bioavailability, and biological function. In therapeutic research, uncontrolled aggregation may lead to reduced efficacy or unwanted immunogenicity, while in materials science, controlled aggregation is harnessed to design nanostructures and biomaterials.
What methods are most commonly used to characterize peptide aggregation?
- The most common methods include spectroscopic techniques such as circular dichroism (CD), fluorescence spectroscopy, and infrared spectroscopy; microscopy methods like atomic force microscopy (AFM) and transmission electron microscopy (TEM); and biophysical techniques such as dynamic light scattering (DLS) and differential scanning calorimetry (DSC). These tools provide complementary insights into aggregate formation, size distribution, and morphology.
How do spectroscopy and microscopy techniques compare in aggregation analysis?
- Spectroscopy offers rapid, quantitative assessment of secondary structure changes and aggregate formation in solution, making it ideal for early detection. Microscopy, on the other hand, provides detailed visual information on aggregate size, shape, and surface topology. In combination, these methods yield both molecular-level and structural insights into aggregation behavior.
What challenges exist in detecting peptide aggregates?
- Detecting peptide aggregates can be difficult due to their heterogeneous and transient nature. Aggregates may vary in size from nanometers to micrometers and can form or dissolve dynamically. Additionally, sample preparation, buffer composition, and peptide concentration can significantly affect aggregation behavior, making reproducibility and accurate quantification challenging.
How can computational tools support peptide aggregation studies?
- Computational tools such as molecular dynamics simulations and machine learning-based prediction models are increasingly used to predict aggregation-prone regions, analyze intermolecular interactions, and simulate aggregation kinetics. These approaches complement experimental methods by offering atomic-level detail and predictive insight into conditions that promote or prevent aggregation.
References
-
Housmans JAJ, Wu G, Schymkowitz J, Rousseau F. A guide to studying protein aggregation. FEBS J. 2023;290(3):554–583. pubmed.ncbi.nlm.nih.gov
-
Pignataro MF, Herrera MG, Dodero VI. Evaluation of Peptide/Protein Self-Assembly and Aggregation by Spectroscopic Methods. Molecules. 2020;25(20):4854.mdpi.com
-
Navarro S, Ventura S. Computational methods to predict protein aggregation. Curr Opin Struct Biol. 2022;73:102343.pubmed.ncbi.nlm.nih.gov
-
Jacobs MR, Grace M, Blumlein A, McManus JJ. Differential Scanning Calorimetry to Quantify Heat-Induced Aggregation in Concentrated Protein Solutions. Methods Mol Biol. 2019;2039:117–129.pubmed.ncbi.nlm.nih.gov
-
Li JY, Zhou CM, Jin RL, et al. The detection methods currently available for protein aggregation in neurological diseases. J Chem Neuroanat. 2024;138:102420.pubmed.ncbi.nlm.nih.gov