
The Role of Circular Dichroism in Peptide Structural Analysis
Author: Dr. Numan S. Date: October 1, 2025

What Is Circular Dichroism?
Circular dichroism (CD) refers to the differential absorption of left- versus right-handed circularly polarized light by chiral molecules [1]. Peptides and proteins, composed of chiral amino acids, exhibit CD because their asymmetrical structures absorb the two polarizations to different extents. In practical terms, a peptide’s CD spectrum is a plot of this absorption difference (ellipticity) across wavelengths. Distinct structural motifs in peptides produce characteristic CD spectral signatures, allowing researchers to infer aspects of a peptide’s conformation. For example, an α-helix typically shows negative CD bands near 208 nm and 222 nm, whereas β-sheet structures show a negative band around 218 nm and a positive band near 195 nm [1]. By analyzing these spectral patterns, scientists can quickly gauge whether a peptide is mostly helical, beta-stranded, or disordered in solution.
Principles of Circular Dichroism Spectroscopy
CD spectroscopy works by passing polarized UV light through a peptide sample and measuring the difference in absorption between left-circularly and right-circularly polarized light [1]. This difference arises because the peptide bonds and side chains in a chiral peptide create an asymmetric environment, absorbing one polarization more than the other. The resulting CD spectrum is essentially a fingerprint of the peptide’s secondary structure – the overall folding motifs like helices, sheets, or random coils. In the far-UV region (roughly 190–250 nm), the peptide backbone (amide chromophore) dominates the CD signal, so this region is most informative for secondary structure analysis. Distinct secondary structures produce distinct spectra as noted above, due to “exciton” coupling between amide bonds in ordered structures [1]. Meanwhile, in the near-UV region (250–300 nm), CD signals arise from aromatic side chains and disulfide bonds, providing insight into the tertiary structure or folding environment of the peptide. In essence, CD spectroscopy translates the structural chirality of a peptide into a measurable optical signal, which can be correlated with known structural features.
Why Circular Dichroism Is Valuable for Peptide Studies
Circular dichroism offers multiple advantages in peptide structural analysis, making it a staple among peptide research methods:
-
Rapid and sample-efficient: CD spectroscopy requires only a small amount of peptide and can collect data within minutes to hours. Measurements can be done on samples with only tens of micrograms of peptide in physiological buffer, yet yield meaningful structural information [1,2].
-
Non-destructive in solution: CD is a non-destructive technique performed on peptides in solution (often in near-physiological conditions), so the same sample can be recovered or measured over time [2]. This allows repeated measurements and preserves precious or fragile peptide samples. Importantly, peptides do not need to be crystallized or immobilized – CD assesses them in their native-like state, which is crucial for observing biologically relevant conformations.
-
Sensitive to conformational changes: CD spectroscopy is extremely sensitive to changes in a peptide’s secondary structure, making it ideal for studying dynamic processes like protein folding and unfolding, ligand binding, or environmental effects [2,3]. Even subtle shifts in helix or sheet content cause noticeable changes in the CD spectrum.
-
Quick structural insight: Although CD does not provide atomic detail, it quickly estimates the overall secondary structure composition (fraction of helix, sheet, etc.) of a peptide [2]. This is invaluable when detailed structures (e.g., from crystallography or NMR) are not yet available. CD can immediately indicate if an engineered peptide is folded predominantly into an α-helix or β-sheet, or if a mutation disrupts its structure [1].
Applications of CD in Structural Analysis
CD spectroscopy plays a versatile role in peptide structural analysis. One primary application is determining secondary structure content. By comparing a peptide’s far-UV CD spectrum to reference spectra of proteins with known structures, researchers can estimate the percentage of α-helix, β-sheet, and random coil present [3]. This secondary structure analysis helps characterize novel peptides – for example, confirming if a designed peptide adopts an alpha-helical structure as intended. Tools like DichroWeb and BeStSel further aid in deconvoluting CD spectra to quantitate secondary structure fractions.
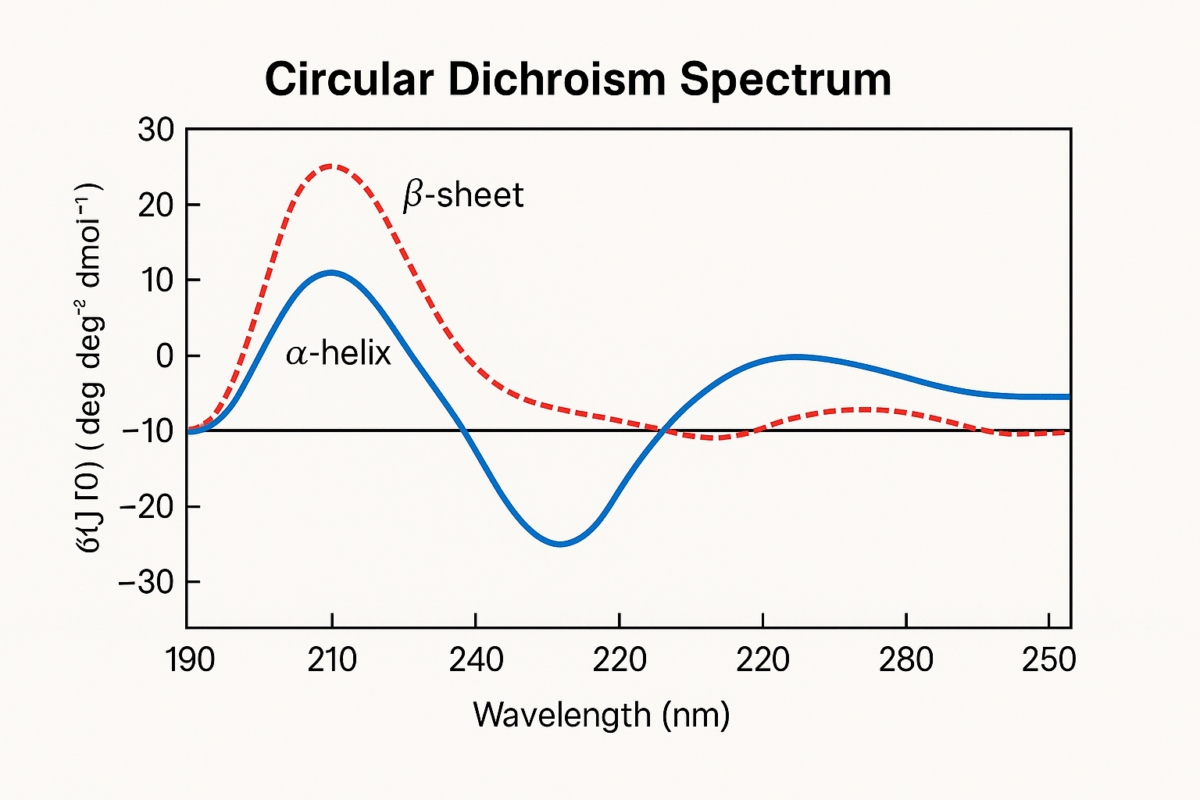
Figure 2: Schematic diagram of a preparative HPLC system for peptide purification.
Another key application is monitoring protein folding and peptide stability. CD is often used to observe folding/unfolding transitions by recording spectra under varying conditions. For instance, by heating a peptide solution and measuring CD at a helix-sensitive wavelength (e.g. 222 nm) as temperature rises, one can generate a melting curve that reveals the peptide’s thermal stability [3]. Similarly, CD spectra recorded as a function of chemical denaturant concentration inform on the unfolding process and stability of the peptide’s structure. These experiments allow researchers to compare the stability of peptide variants or the effects of mutations on foldability. The ability to track protein folding pathways in real time is a major asset of CD spectroscopy, yielding insights into the kinetics and mechanism of folding by capturing intermediate structural changes.
CD is also employed to detect conformational changes upon interactions. When a peptide binds to another molecule (such as a protein partner, nucleic acid, or small ligand), it often undergoes a structural change – for example, an unstructured peptide might fold into an α-helix upon binding. CD can monitor this by comparing spectra before and after binding: the appearance of new ellipticity signals or shifts in peaks indicates a binding-induced conformational change [2]. This makes CD a convenient tool for studying peptide–protein or peptide–drug interactions. In addition, far-UV CD can confirm if a peptide maintains its structure in different environments, while near-UV CD can reveal changes in the tertiary environment of aromatic residues upon ligand binding. Overall, the applications of CD range from basic secondary structure profiling to real-time monitoring of folding and binding events – all crucial for understanding peptide behavior and function.
Monitoring Folding and Stability with Circular Dichroism
A particularly powerful use of CD spectroscopy is in monitoring protein folding processes and evaluating peptide stability. Because CD is sensitive to secondary structure, researchers can observe a peptide’s folding in real time by recording CD changes. In equilibrium studies, the peptide’s CD spectrum is measured at increasing concentrations of a denaturant or as the temperature is gradually raised. The loss of characteristic helix or sheet signals indicates unfolding; plotting ellipticity vs. condition yields sigmoidal curves from which the midpoint of unfolding and thermodynamic stability can be derived [3]. Using CD in this way, scientists have profiled the stability of countless peptides and small proteins. CD is especially handy for this purpose because it can detect partial unfolding and requires no special probes or labels. In summary, CD allows for straightforward assessment of peptide stability and folding, providing insights into how robust a given peptide’s structure is and how it responds to stressors.
Identifying Secondary Structures in Peptides
One of the hallmark applications of CD is secondary structure analysis of peptides and proteins. Different secondary structures produce distinct CD spectral features [1], which serve as diagnostic signatures. For instance, an α-helix yields two pronounced negative minima (around 208 nm and 222 nm) and a positive maximum near 190 nm [1]. A β-sheet structure typically shows a single negative band around 215–218 nm and a strong positive band near 195 nm [1]. A largely unstructured peptide gives a CD spectrum characterized by low ellipticity above 210 nm and a deep negative band near ~198 nm [1]. By matching a given peptide’s CD spectrum to these patterns, one can infer its predominant secondary structure. Moreover, online servers such as DichroWeb or BeStSel can estimate helix, sheet, and coil content from CD spectra [2]. Identifying secondary structure via CD is especially useful during peptide design or synthesis: one can verify if a designed β-sheet peptide indeed adopts β-structure, or monitor secondary structure changes upon modifying a peptide’s sequence. While CD cannot pinpoint the exact positions of these structures along the peptide chain, it provides a fast and reliable overview of structural motifs in solution.
Limitations of Circular Dichroism in Structural Analysis
Despite its utility, CD spectroscopy has important limitations in structural analysis:
-
Limited structural resolution: CD provides only coarse-grained information. It reveals the overall secondary structure composition but cannot deliver precise tertiary structure or atomic-level details [3].
-
Spectral overlap and interpretation ambiguity: Many secondary structure signals overlap, and most peptides contain mixed structures. This can make interpretation ambiguous [3,5]. Different conformations can produce similar CD profiles, so CD-based secondary structure estimates are reliably accurate only for proteins that are predominantly all-α or all-β [5].
-
Sensitivity to experimental conditions: CD measurements can be affected by sample and buffer conditions [3]. Peptides must be in a buffer that is transparent in the far-UV, which limits the use of certain salts or additives. Accurate CD analysis requires precise peptide concentration and clean, monodisperse samples. These practical considerations mean that obtaining high-quality CD data is not always straightforward, especially for peptides that are poorly soluble or prone to aggregate.
Complementary Techniques to CD (NMR, X-ray, etc.)
No single method can provide a complete picture of peptide structure, and CD is typically used in conjunction with other techniques. High-resolution methods like X-ray crystallography and nuclear magnetic resonance (NMR) spectroscopy are complementary to CD [4]. X-ray crystallography can reveal the detailed 3D atomic structure of a peptide, while NMR provides residue-specific structural data in solution [4]. CD fills a niche by quickly indicating whether a peptide is folded and what general structure it adopts, even if exact atomic coordinates are out of reach [2].
Other analytical techniques also complement CD in peptide research. Infrared (IR) spectroscopy can estimate secondary structure content by analyzing amide bond vibrations, and Raman spectroscopy probes secondary structures as well [3]. Additionally, cryo-electron microscopy (cryo-EM) provides high-resolution structures of large complexes, while computational predictors like AlphaFold can model structures that CD then validates. Used together, these methods paint a comprehensive picture of peptide structure and dynamics [4].
Conclusion: Advancing Peptide Research with Circular Dichroism
Circular dichroism spectroscopy has emerged as a powerful tool in advancing peptide research, offering insights that are both unique and complementary to other methods. In the realm of peptide structural analysis, CD stands out for its speed, simplicity, and sensitivity. It enables scientists to rapidly assess whether a peptide is folded and what secondary structures it contains, information that is critical for understanding function and designing new peptides. CD is especially invaluable for studying protein folding and peptide stability, as it can monitor structural changes in real time under various conditions [2,3]. This ability to probe dynamic behavior provides a window into peptide conformational flexibility.
Equally important, CD spectroscopy complements the high-resolution techniques in peptide research methods. While X-ray crystallography, NMR, and cryo-EM reveal fine structural details, CD fills in the gaps by confirming the presence of structural motifs and observing changes in real time. Together, these approaches greatly enrich our understanding of peptides. By leveraging circular dichroism alongside other peptide research methods, scientists can more efficiently decode how a peptide’s structure relates to its stability and function [2]. In conclusion, CD spectroscopy continues to advance peptide research by providing rapid, insightful structural fingerprints, ultimately helping researchers unravel folding mechanisms, optimize peptide stability, and design better peptide-based solutions in medicine and biotechnology [2,3].
Frequently asked questions (FAQs) about Circular Dichroism in Peptide Structural Analysis
What is circular dichroism and how does it work?
- Circular dichroism (CD) is a spectroscopic technique that measures the difference in absorption between left- and right-handed circularly polarized light by chiral molecules such as peptides and proteins. Because peptide bonds and certain side chains are optically active, their electronic transitions generate distinct CD spectra depending on the secondary structure present. By analyzing the shape and intensity of these spectra—particularly in the far-UV region (190–250 nm)—researchers can infer structural motifs like α-helices, β-sheets, and random coils.
How is circular dichroism applied in peptide structural analysis?
- In peptide research, circular dichroism spectroscopy is used to assess secondary structure content, monitor folding behavior, and evaluate conformational changes under different environmental conditions. It provides rapid, non-destructive insights into peptide conformation in solution, allowing scientists to study how variables such as pH, temperature, ionic strength, or solvent composition influence structure. CD is often employed alongside complementary techniques to validate or refine structural models derived from computational or higher-resolution methods.
What can CD spectroscopy reveal about peptide folding and stability?
- CD spectroscopy can track peptide folding pathways in real time, revealing how peptides transition between ordered and disordered states. Because CD spectra are sensitive to hydrogen bonding and backbone conformations, researchers can detect thermal or chemical denaturation, quantify the proportion of helical versus sheet content, and determine melting temperatures (Tm). These parameters provide valuable information about a peptide’s stability, folding kinetics, and interactions with other biomolecules or ligands.
What are the limitations of circular dichroism in peptide research?
- Although circular dichroism is powerful for detecting global structural features, it has limited resolution compared to high-precision methods such as X-ray crystallography or nuclear magnetic resonance (NMR). CD cannot pinpoint the exact positions of residues or tertiary interactions. Its accuracy may also be influenced by buffer composition, light scattering from aggregates, or sample impurities. Therefore, CD data are often interpreted as part of a broader analytical framework rather than as a stand-alone determinant of structure.
How does circular dichroism compare to other structural analysis methods?
- Circular dichroism offers speed, simplicity, and minimal sample requirements, making it ideal for routine secondary structure evaluation and stability testing. However, unlike NMR or X-ray crystallography, CD provides only averaged secondary structure information rather than detailed atomic-level models. Complementary techniques such as Fourier-transform infrared (FTIR) spectroscopy, differential scanning calorimetry (DSC), and molecular dynamics simulations are frequently combined with CD to achieve a more complete picture of peptide conformation and dynamics.
References
-
Greenfield NJ. Using circular dichroism spectra to estimate protein secondary structure. Nat Protoc. 2007;1(6):2876–2890. https://pubmed.ncbi.nlm.nih.gov/17406547/ (PMCID: PMC2728378)
-
Linhares LA, Ramos CHI. Unlocking Insights into Folding, Structure, and Function of Proteins through Circular Dichroism Spectroscopy—A Short Review. Applied Biosciences. 2023;2(4):639–655.
-
Qinghua H. Optical Insights into Structural Biology Harnessing the Power of CD Spectroscopy. J Anal Bioanal Tech. 2024;15:643.
-
Rogers DM, Jasim SB, Dyer NT, et al. Electronic Circular Dichroism Spectroscopy of Proteins. Chem. 2019;5(11):2751–2774.
-
Khrapunov S. Circular dichroism spectroscopy has intrinsic limitations for protein secondary structure analysis. Anal Biochem. 2009;389(2):174–176. https://pubmed.ncbi.nlm.nih.gov/19332020/